DEVELOPMENT FACTORS OF PARTNERSHIP SALES
NETWORKS IN THE SUPPLY CHAIN OF A TELECOM –
CASE STUDY
Łukasz Brzeziński* and Magdalena K. Wyrwicka**
Faculty of Engineering Management, Poznan University of Technology, Strzelecka 11, 60-965, Poznan, Poland,
* Email: lbrzezinski@o2.pl
** Email: magdalena.wyrwicka@put.poznan.pl
Abstract: The operation of a supply chain is related to the flow of products and services between
suppliers and buyers. Partnership sales networks play a special role in the supply chain in the telecom market. The article’s purpose is to analyse factors behind the development of partnership sales networks in the supply chain of a telecom. A network analysis method was applied. “Pajek” software, created by Vladimir Batagejl and Andrej Mrvar was used as a tool for analysis and visualisation. The results of the research allowed to examine main factors of the development of a partnership sales network of the analysed entity, which included: the reduction of the number of employees and the reduction of sales commissions. This served as a basis to develop a probable development scenario (until 2022).
Paper type: Research Paper Published online: 19 October 2018 Vol. 8, No. 4, pp. 329–339
DOI: 10.21008/j.2083-4950.2018.8.4.4 ISSN 2083-4942 (Print)
ISSN 2083-4950 (Online)
© 2018 Poznan University of Technology. All rights reserved.
Keywords: telecom supply chain, partnership sales network, development factors of
1. INTRODUCTION
Supply chains are now a dynamically growing concept of managing companies (or networks of companies). The concept’s development is mainly connected to the dynamic changes in the businesses’ economic and technological environment (Kruczek & Żebrucki, 2011, pp. 355–362).
Partnership sales networks play an important role in the telecom market supply chain, being responsible for the distribution of services and products and at the same time performing sales processes.
A network is an organizationally tied structure present within and/or outside a company, with its own resources and tasks. The structure is also a link connecting the market and the organization, through which sales of goods, among else, is performed. It should be noted that from the perspective of the operation of a sales network, shaping its growth is also its functionality.
Three types of sales networks operate in telecoms. These are: an own sales network and a partnership sales network – also called an external or dealer’s network, and mixed sales – where both previously listed solutions operate simulta-neously. The operation of a company’s own sales network is fully dependent on its resources: the employees are employed under employment contracts. However, partnership sales networks are usually based on trade agreements and most of the operating costs are, as it were, passed onto businesses operating in this kind of network.
The subject of the examinations covered in the paper is a partnership sales network created by a selected telecom in Poland. A partnership sales network is an alternative or joint solution (in case of mixed networks) in relation to own sales networks. The structure is composed of organizations performing sales operations for the contracting business. These organization use the contracting business’ resources but are not directly a part of its organizational range.
The article’s purpose is to analyse factors behind the development of partnership sales networks in the supply chain of a telecom. A network analysis method was applied.
2. ANALYSIS OF FACTORS AFECTING THE DEVELOPMENT OF
PARTNERSHIP NETWORKS IN A TELECOM’S SUPPLY CHAIN
2.1. The specifics of a chain supply in the telecom market
A supply chain is one of the elements of a division based on a fundamental concept of a logistics chain, which is a general set of elements consisting of
organi-zations connected with spatial and temporal sequence for the purpose of completion of a specific goal that is directly connected with logistics (Fechner, 2007, p. 11).
The concept of a supply chain was created when systemic approach became popular in 1980s. The term “supply chain” was used, for the first time, by R.K. Oli-ver and M. Weber who wished to draw attention to the aspect of inter-functional integration of organisations that commence cooperation. Then, the term appeared in literature in the context of an approach, a concept, a perspective, philosophy or a technique (Blaik, 2010, pp. 66–88).
The economic reality usually sees complex forms of supply chains. Most organisations have numerous suppliers and numerous buyers. One can therefore notice the term of a complex supply chain, which consists of such links as a supplier, a manufacturer, a buyer, along with other elements such as a provider of logistics services, IT services, financial services, telecom services, etc. This is a highly integrated chain (partners follow similar standards with regards to packaging, process monitoring, communication, etc.) (Fechner, 2007, p. 17).
An initial link can be distinguished in a supply chain, usually a supplier providing materials and raw materials to the producer, indirect links participating in processing these into sets and finished goods, and a final link, usually an organization supplying the goods to clients.
In a phase view, the telecom market supply chain consists of the supply (suppliers), sales (telecom operators, sales networks) and distribution (sales networks, courier firms). The supply covers organizations supplying products offered by telecom operators (phones, smartphones, laptops, notebooks, modems, tablets and other devices). The sales of telecom services and products is done via sales networks (own and partner) of telecom operators. The distribution of products, however, is done by courier firms and sales networks, including partnership networks. It should be also pointed out that partnership sales networks actively participate in the sales and distribution phase. They also determine, to a large degree, the functioning of suppliers.
The entities making up a partnership sales network are organizations. Therefore, the leading entity – the parent company (creating the network) establishes cooperation on the basis of trade agreements (cooperation agreements) with partners who will be performing product and service sales processes for the parent company. In turn, the partners shape, on their own, their own sales structures. Operating costs result from the labour intensity of the tasks. Consequently, the remuneration for performing sales processes for the parent company by a partner is commission-based, as specified in the agreement. This results from the allocation of tasks among certain entities. Similar reactions are present between the partner and sales representatives employed in the partnership sales network. All operating costs are, in a way, “passed on” to the sales reps. Own and partnership sales networks, apart from a certain convergence in the very purpose of their operation, which may be synthetically identified as a high efficiency of sales processes, differ
significantly in their operation and incorporation into a company’s structures. Therefore, comparing them seems justified.
The operation of a sales network depends on numerous elements, in particular consisting of the employed staff, providing adequate offer to the buyers, providing support for the employees in the form IT tools, allocation of materials resources such as offices and their equipment. Additionally, the location of structures within the area covered with activities should be based on current needs and market trends.
2.2. Factors of development of partnership sales networks – own
research
The analysis covering the identification of the factors of development of the partnership sales network of organization the method of network analysis was applied, used for detecting, describing and identifying relations among groups of individuals or organisations (Wassermann & Faust, 2007).
This is an interdisciplinary method that uses elements of the theory of graphs, statistics, matrix algebra, as well as sociology, social psychology or anthropology, which focuses on the structure of relations existing among social subject (individuals, teams, organizations, regions, etc.). If this method is used, its limitations should be borne in mind. Network analysis is used in practice (mainly in analytical processes) in management science, both on pan-organizational level, including inter-regional level (Reid, Smith & Carroll, 2008, pp. 345–353), and in relation to widely understood activity of businesses (Kijkuit & van den Ende, 2010, pp. 451–479).
“Pajek” software, created by Vladimir Batagejl and Andrej Mrvar was used for analysis and visualisation (Brzeziński & Wyrwicka, 2015; Brzeziński, Kliber & Wyrwicka, 2016; Program, 2015), allowing to reflect the relations and interact-tions among elements creating partnership sales networks and individual factors.
The identification of development factors allowed the projection of possible changes, tendencies and directions. D. Prognosis is mid-term and covers the nearest 5 years (namely up to 2022). A scale commonly used in scenario methods, rooted in relevant literature (see Giereszewska & Romanowska, 2002) was used to identify the acting forces. Factors were selected during the research process, whose acting force is stimulating (a positive acting force) on a scale from 1 to 5 (with 1 being very weak effect and 5 being very strong effect) or destimulating (negative acting force) on a scale from –1 to –5 (with –1 being very weak effect and –5 very strong effect). The factors were selected on the basis of an in-depth review with an individual managing a partnership sales network in the company. During the interview, the individual managing the partnership sales network at the given operator would list individual factors and whether the force is stimulating or destimulating and to what degree.
The specific measures of acting forces were calculated as a result: the weighted evaluation of the individual managing the partnership sales network (oz) and the author’s evaluation (oa) – coefficients, respectively, 0.6 and 0.4 – and then rounded up to full values, expressed as a formula:
Table 1 presents the factors and their acting force on the partnership sales networks of the examined organizations.
Table 1. Factors of development and their acting force on the partnership sales network of organization
Factors Entity A
Absenteeism –3
Errors during work –3
Missing documentation for agreements –2
Lack of expected products in stock –4
Manager’s decisions 3
Additional tasks –2
Form of placing orders 2
Number of clients 4
Amount of ongoing work 2
Completeness of documents 3
Workload 3
Reduced sales commission –5
Responsibility for service quality 2
Responsibility for achieving goals 3
Work organization 2
Partnership with another telecom entity 4
Launching new stores 1
Preferences for contacting clients 3
Promotions 5
Tenders for telecom frequencies 5
Reduction of partnership network –5
Ads with celebrities 4
Client complaints –2
Meetings 2
Sales standard 3
Work seniority –2
Application of ISO 900:2008 standard in client
service –
Stress –3
Price war 2
Organization’s values 3
Organization‘s image 3
Cooperation with other departments 1
Business trips 3
Communication guidelines for employees 2
Team management –2
Clients submitting complaints 4
Knowledge of offer by clients 4
To identify factors that will have the biggest impact in the future on the partnership sales networks covered by the examination three network analysis factors will be used: intermediary value, proximity value and cumulative vector value.
The intermediary value of node v determines the ratio of the number of the shortest paths between any two nodes passing through node v to the total number of all shortest paths. Sometimes the intermediary is normalized so that the maximal intermediary in the network is 1. The term proximity ratio of node v refers to the average length of the shortest paths between node v and all remaining nodes (in other words, this is the expected length between node v and any other node). This is the measure of reach of a specific node, or the measure of time needed to arrive at other nodes from a given node. The cumulative value of the vector is the total value declared in connections (edges) directed to a given network link.
Assessing the described ratios allows to determine factors that may be crucial, in the future, for shaping and functioning of partnership sales networks. The intermediary ratio determines the probability with which a given factor may be of crucial importance for the entire network. Proximity means the reach a given factor has (how it can affect the network’s remaining links). The cumulative vector value shows the role a given factor plays in the network.
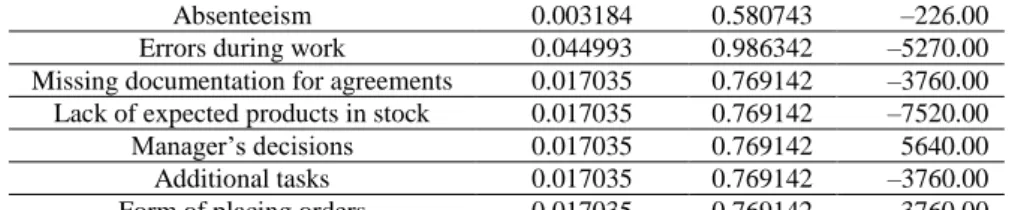
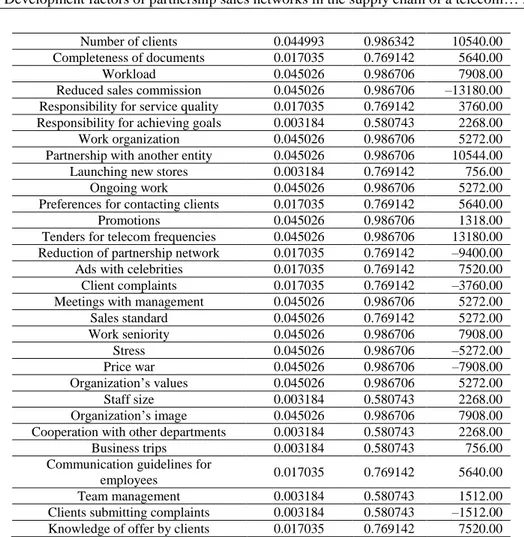
The values of intermediary, proximity and cumulative vector were determined and a visualization of a partnership sales network was created, which shows the impact (stimulating or destimulating) of individual factors, apart from the staff structure. Table 2 presents the values of intermediary, proximity and cumulative vector for organization.
Table 2. Value of intermediary, proximity and cumulative vector of development factors of a partnership sales network of organization
Factors Intermediary Proximity Cumulative vector
Absenteeism 0.003184 0.580743 –226.00
Errors during work 0.044993 0.986342 –5270.00
Missing documentation for agreements 0.017035 0.769142 –3760.00 Lack of expected products in stock 0.017035 0.769142 –7520.00
Manager’s decisions 0.017035 0.769142 5640.00
Additional tasks 0.017035 0.769142 –3760.00
Number of clients 0.044993 0.986342 10540.00
Completeness of documents 0.017035 0.769142 5640.00
Workload 0.045026 0.986706 7908.00
Reduced sales commission 0.045026 0.986706 –13180.00 Responsibility for service quality 0.017035 0.769142 3760.00 Responsibility for achieving goals 0.003184 0.580743 2268.00
Work organization 0.045026 0.986706 5272.00
Partnership with another entity 0.045026 0.986706 10544.00
Launching new stores 0.003184 0.769142 756.00
Ongoing work 0.045026 0.986706 5272.00
Preferences for contacting clients 0.017035 0.769142 5640.00
Promotions 0.045026 0.986706 1318.00
Tenders for telecom frequencies 0.045026 0.986706 13180.00 Reduction of partnership network 0.017035 0.769142 –9400.00
Ads with celebrities 0.017035 0.769142 7520.00
Client complaints 0.017035 0.769142 –3760.00
Meetings with management 0.045026 0.986706 5272.00
Sales standard 0.045026 0.769142 5272.00 Work seniority 0.045026 0.986706 7908.00 Stress 0.045026 0.986706 –5272.00 Price war 0.045026 0.986706 –7908.00 Organization’s values 0.045026 0.986706 5272.00 Staff size 0.003184 0.580743 2268.00 Organization’s image 0.045026 0.986706 7908.00
Cooperation with other departments 0.003184 0.580743 2268.00
Business trips 0.003184 0.580743 756.00
Communication guidelines for
employees 0.017035 0.769142 5640.00
Team management 0.003184 0.580743 1512.00
Clients submitting complaints 0.003184 0.580743 –1512.00 Knowledge of offer by clients 0.017035 0.769142 7520.00
Figure 1 shows the visualization of the partnership sales network of organization and its determinants. It should be noted that an exceptionally elaborate network of dependences was created during the analyses. Apart from relations among emp-loyees, it contained the impact of factors presented in Table 1. The number of elements making the network up was 2,673 in organization, while the number of all connections (relations) was 83,243. Such a number of relations is difficult to show on a picture.
In terms of intermediary values the following factors had the highest values: work organization, workload, meetings with management, work seniority, reduced sales commission, ongoing work, stress, organization’s value, sales standards, partnership with another telecom entity, price war, tenders for telecom frequencies and organization’s image (all at 0.45026).
In terms of proximity these were promotions, work organization, workload, number of clients, reduced sales commission, ongoing work, errors during work, organization’s value, partnership with another telecom entity, price war, organization’s image (all at 0.986706).
Factors such as reduced sales commission (–13180.00) and reduction of partnership network (–9400.00) had the highest destimulating (negative) cumu-lative value of the vector. The number of clients (10540.000000), partnership with another telecom entity (10544.00) and tenders for telecom frequencies (13180.00) had the highest positive (stimulating) values.
3. CONCLUSION
Partnership sales networks constitute a fundamental element of a telecom supply chain – they are responsible for the distribution of telecom services and partially for delivering the ordered products (phones, smartphones, tablets, notebooks, etc.). It can be therefore said that changes in the operation of partner-ship sales networks significantly affect the operation of a supply chain.
The number of individuals engaged in the operation of the partnership sales network will keep decreasing. This is related to the dwindling dynamics of growth of the telecom market and the reduced sales profitability. Organization is a leader in attracting clients who switch operators. Hence, the process of reduction of the number of staff of the partnership sale network should proceed slowly until 2022.
An important element not only affecting the maintenance of the current level of sales but also its increase is the planned partnership with another telecom entity (with regard to landlines). This will expand the offer and the range of services provided to clients. The employees of the partnership sales network will acquire a sizeable group of clients, both individual and business ones. Tenders for telecom frequencies will have a big impact on the entire industry. This applies to fast Internet connection in particular. The tender was already cancelled and the possibility of launching quick, mobile Internet service is an important part of competition.
Apart from the factors discussed above, promotions were also highlighted on the basis of the analysis. They constitute an unusually important determinant of the operation of the entire sales network (not just the partnership network). Having an offer that has unique features distinguishing a service or a product from the competition cannot be overestimated. Price promotions is inseparable from price war, which will intensify in the coming years.
REFERENCES
Blaik P. (2010), Logistyka, koncepcja zintegrowanego zarządzania, PWE, Warszawa. Brzeziński Ł., Kliber M.C. & Wyrwicka M.K. (2016), The support of analysis of level for
customer service by network visualization, Research in Logistics & Production, Vol. 6, No. 1, pp. 25–38.
Brzeziński Ł. & Wyrwicka M.K. (2015), Wykorzystanie wizualizacji sieciowej do stymulacji wzrostu przedsiębiorstwa, [in:] L. Kiełtyka, R. Niedbał (eds.), Wybrane zastosowania technologii informacyjnych wspomagających zarządzanie w organiza-cjach, Wydawnictwo Politechniki Częstochowskiej, Częstochowa.
Fechner I. (2007), Zarządzanie łańcuchem dostaw, Wyższa Szkoła Logistyki, Poznań. Gierszewska G. & Romanowska M. (2002), Analiza strategiczna przedsiębiorstwa, PWE,
Warszawa.
Kijkuit B. & van den Ende J. (2010), With a Little Help from Our Colleagues: A Longitudinal Study of Social Networks for Innovation, Organization Studies, Vol. 31, No. 4.
Kruczek M. & Żebrucki Z. (2011), Doskonalenie struktury łańcucha dostaw z wykorzystaniem koncepcji lean, Logistyka, Vol. 2, pp. 355–363.
Program for Large Network Analysis, <http://vlado.fmf.uni-lj.si/pub/networks/pajek/> [accessed: 7.07.2015].
Reid N., Smith, B.W. & Carroll M.C. (2008), Cluster Regions: A Social Network Perspectives, Economic Development Quarterly, Vol. 22, No. 4.
Wasserman S. & Faust K. (1994), Social Network Analysis: Methods and Applications (Structural Analysis in the Social Sciences), Cambridge University Press, Cambridge.
BIOGRAPHICAL NOTES
Magdalena Krystyna Wyrwicka, Ph.D., D.Sc., Eng. is a professor and a dean at
the Faculty of Engineering Management at Poznan University of Technology in Poland. As a Ph.D. in technical sciences (her work applied to implementation of automation), she has studied the issues of human resource management and small and medium size enterprises’ management at the Witschaftsuniversität in Vienna which constituted the basis for her post-doctoral degree in the scope of management science and it centred on a range of problems connected with organizing an enterprise’s development and networks’ development.
She is a licensed teacher of German REFA (Verband fϋr Arbeitsgestaltung, Betriebsorganisation und Unternehmensentwicklung) in the elementary scope and production planning and control. She is in contact with economic practice. She is an author and a co-author of more than 210 publications. Her scientific research concentrates on premises concerning the development of a company and companies’ networks. She has been managing a project called “Foresight ‘Wielkopolska’s Economic Networks’ – scenarios of knowledge transformations supporting an innovative economy” in the scope of an Operational Programme of an Innovative Economy.
Łukasz Brzeziński Ph.D., graduate of doctoral study at the Faculty of Engineering
Management in Poznan University of Technology. He concerns such research areas as: enterprises development, outsourcing of sales forces and logistics. During the doctoral studies he participated in the research work of the Faculty of Management Engineering at the Poznan University of Technology, among others Foresight – economic networks of Wielkopolska. He is an author and a co-author of 10 publications.