Polish Academy of Sciences
____________________________________________________________________
Kateryna LEBED
ATOMIC FORCE MICROSCOPY STUDIES OF
MICROPATTERNED PROTEINS
Dissertation for the Doctor of Philosophy Degree in Experimental Physics
Scientific supervisor: Prof. dr hab. Jan Styczeń
CONTENTS
ABBREVIATIONS ……….. 5
BASIS OF THE THESES ……….. 6
INTRODUCTION ……… 8
CHAPTER 1. LITERATURE REVIEW ……… 16
1.1. Atomic force microscopy (AFM) ………. 16
1.1.1. Principle of AFM operation …………..……….. 16
1.1.2. Force spectroscopy (FS) ………..……… 18
1.1.3. Dynamic force spectroscopy (DFS) ………..……… 21
1.2. Microcontact printing (µCP) technique ………. 24
1.2.1. Surface modification ………..………..……… 25
1.2.2. Protein immobilization via covalent cross-linking ………….. 26
1.2.3. Spatially controlled immobilization of biomolecules ………… 27
1.2.4. Microcontact printing technique ………...…… 28
1.3. Lectin-carbohydrate interaction ……….. 30
1.4. Quartz crystal microbalance (QCM) ……….. 32
1.5. Fluorescence microscopy ……….. 35
1.6. Conclusions to Chapter 1 ……….. 37
CHAPTER 2. MATERIALS AND METHODS ………….……… 39
2.1. Materials ……….. 39
2.2. Protein deposition ……….…….. 39
2.3. Protein patterning ……….……….. 44
2.4. Atomic force microscopy ……….……….. 45
2.5. Quartz crystal microbalance ………..……… 46
2.6. Fluorescence microscopy ……… 47
2.7. Conclusions to Chapter 2 ……….…….. 48
CHAPTER 3. PROTEIN PATTERNING BY µCP TECHNIQUE .………….. 49
3.1. Studies of the patterned surface of the fabricated PDMS stamps ………... 49
3.2. Microcontact printing of proteins ………..…………... 52
3.2.1. Topography of the pre-modified glass coverslip surface …….. 52
3.2.2. Fluorescence microscopy imaging of protein patterns ………. 54
3.2.3. AFM imaging of surface topography of protein patterns …….. 58
3.3. Verification of the biological activity of patterned proteins ………...……….…… 62
3.3.1. Fluorescence microscopy studies………...…………... 62
3.3.2. Force spectroscopy studies………...………. 64
3.4. Discussion ……… 65
3.5. Conclusions to Chapter 3 ……..………. 68
CHAPTER 4. AFM COMBINED WITH µCP TECHNIQUE FOR LECTIN-CARBOHYDRATE INTERACTION STUDIES….. 69
4.1. The performance of the force spectroscopy in combination with the microcontact printing …….………… 69
4.2. Force spectroscopy data classification and selection ……….. 71
4.3. Mapping of the force values obtained from patterned substrates ……….……….. 77
4.3.1. Force maps of the Con A/glutaraldehyde patterns ….…...…… 77
4.3.2. Force maps of the Con A/BSA and LcH/BSA patterns …..…… 80
4.4. Force distribution histograms ……… 82
4.5. Dynamic force spectroscopy of the Con A-CaY and LcH-CaY unbinding …..…….………….. 83
4.6. Control measurements ……….……….. 86
4.7. Discussion ……….………... 87
4.8. Conclusions to Chapter 4 ………... 93
CHAPTER 5. VERIFICATION OF AFM-µCP RESULTS: QCM STUDIES OF LECTIN-CARBOHYDRATE INTERACTION KINETICS ………... 95
5.1. Protein deposition ………... 95
5.3. Motional resistance measurements ..………. 98
5.4. Estimation of kinetic parameters …….………. 100
5.5. Discussion ……….………... 102
5.6. Conclusions to Chapter 5 ………...……… 105
CONCLUSIONS ..……….……….…. 106
REFERENCES ………..……….……… 108
ABBREVIATIONS
ACE affinity capillary electrophoresis AFM atomic force microscopy
APTES 3-aminopropyltriethoxysilane
BSA bovine serum albumin
CaY carboxypeptidase Y
Con A concanavalin A
Con A-FITC concanavalin A labelled with fluorescein isothiocyanate DFS dynamic force spectroscopy
ELISA enzyme linked immunosorbent assay
FS force spectroscopy
HPLAC analytical affinity chromatography LcH lentil lectin
LcH-TRITC lentil lectin labelled with
tetramethylrhodamine isothiocyanate
MD molecular dynamics
NMR nuclear magnetic resonance
PDMS poly(dimethylsiloxane)
PDB protein data bank
PSD position sensitive detector
RMS root-mean-square
QCM quartz crystal microbalance
SD standard deviation
SEM standard error of the mean
SPR surface plasmon resonance TBS TRIS buffered saline
TRIS 2-amino-2-(hydroxymethyl)-1, 3-propandiol µCP microcontact printing
BASIS OF THE THESIS
The thesis has been based on the original material that has been presented in the following publications of the author with co-authors:
[1] Gryboś J., Pyka-Fościak G., Lebed K., Lekka M., Lekki J., Stachura Z., Styczeń J. Study of adhesion interaction using scanning force microscopy // Acta Phys. Pol. A- 2004.- Vol.105.- P.501-510.
[2] Lebed K., Gryboś J., Pyka-Fościak G., Lekka M., Styczeń J. AFM characterization of carbohydrate binding activity of patterned lectins // J. Phys. Condens. Mat.- 2005.- Vol.17.- P.S1447-S1458.
[3] Lebed K., Kulik A., Forró L., Lekka M. Lectin-carbohydrate affinity measured using quartz crystal microbalance // J. Colloid. Interf. Sci.- 2006.- Vol.299.- P.41-48 .
[4] Lebed K., Lekka M., Dąbrowska A., Kulik A., Lekki J., Stachura Z. Combined AFM and microcontact printing techniques // Condensed Matter: New Research // edited by Das M.P.- New York: Nova Science Publishers, 2006.- ISBN: 1-60021-022-8.
[5] Lebed K., Dąbrowska A, Sharma G., Lekki J., Stachura Z., Lekka M. Force spectroscopy of mannose-binding to patterned concanavalin A and lentil lectin // Conference Proceedings Book.- Linz: Trauner, 2006.
[6] Dąbrowska A., Lebed K., Lekka M., Lekki J., Kwiatek W.M. The comparison between fibronectin and contactin unfolding // accepted for publication in J. Phys. Condens. Mat.
[7] Lebed K., Kulik A., Forró L., Lekka M. Atomic force microscopy and quartz crystal microbalance study of the lectin-carbohydrate interaction kinetics // sent to Acta Phys. Pol. A.
[8] Dąbrowska A., Lebed K., Kulik A. J., Forró L., Lekka M. Mechanical unfolding of fibronectin under different chemical conditions // sent to J.Struct.Biol.
[9] Lebed K., Dąbrowska A, Sharma G., Lekki J., Hjort K., Lekka M. Force measurements of the single concanavalin A/mannose and lentil lectin/mannose complexes unbinding // (in preparation) to be published in Eur.Biophys.J.
The results of the thesis have been also presented at the scientific conferences and consequently in the abstract books of the conferences:
[10] Lebed K., Gryboś J., Pyka-Fościak G., Lekka M., Styczeń J. Interaction between glycoproteins and patterned lectins studied using AFM // Proc. of the Europhysics Conference “Workshop on Structure and Function of Biomolecules”.- Będlewo.- 2004.- P.75.
[11] Lebed K., Gryboś J., Pyka-Fościak G., Lekka M., Styczeń J. Wzory białkowe wykonane techniką druku mikrokontaktowego badane za pomocą AFM // Proc. of the Third Seminar "Badania prowadzone metodami skaningowej spektroskopii bliskich oddziaływań STM/AFM 2004".- Zakopane.- 2004.- P. 12. [12] Lebed K., Pyka-Fościak G., Lekka M., Stachura Z., Kulik A., Forró L. Studying
of lectin-carbohydrate interaction // Proc. of the International Symposium “Breaking Frontiers:Submicron Structures in Physics and Biology”, XL Zakopane School of Physics.- Zakopane.- 2005.- P. 33.
[13] Lebed K., Dąbrowska A., Sharma G., Lekka M., Stachura Z., Lekki J. Force spectroscopy of mannose-binding to patterned concanavalin A and lentil lectin // Proc. of the VIII Annual Linz Winter Workshop “Advances in Single-Molecule Research for Biology and Nanoscience”.- Linz.- 2006.- P.I-8.
[14] Lekka M., Kulik A., Pyka-Fościak G., Jeney S., Lebed K., K. Li, Forró L. Antigen-antibody interaction studied using friction force microscopy // Proc. of the VIII Annual Linz Winter Workshop “Advances in Single-Molecule Research for Biology and Nanoscience”.- Linz.- 2006.- P.17.
INTRODUCTION
Topicality of the work. The atomic force microscopy (AFM) covers a wide spectrum of applications in physics, biology, material sciences, etc. AFM is usually applied to image the topography of a sample surface, but it can also deliver information about mechanical properties of the sample, such as its stiffness or strength of interaction between the sample surface and the AFM probe.
The latter AFM application, termed a force spectroscopy (FS), enables measuring interaction forces between a single pair of molecules with the force resolution down to tens of picoNewtons. Therefore it has been successfully applied to measure either the picoNewton forces of non-covalent bonds formed between various ligand-receptor pairs, such as protein-protein, antigen-antibody and complementary DNA strands, or the nanoNewton forces of strong covalent bonds.
The force spectroscopy performed with the growing unbinding rates – the so-called dynamic force spectroscopy (DFS), gives the possibility to study the kinetics of the dissociation of molecular complexes and to characterize the energy landscape of this process.
Thus, AFM in its dynamic force spectroscopy mode provides quantitative parameters characteristic for a given type of molecular complex and, therefore, it could be treated as a biosensor technique. The construction of AFM meets main requirement formulated for biosensors: the conjunction of biological receptor layer (i.e. molecules immobilized on the hard surface) and the transducer of the biochemical signal (i.e. the optical system of AFM). However, to make the dynamic force spectroscopy mode of AFM a widely used analytical technique or a biosensor, the data processing and analysis should be improved to make it easier and faster.
The data obtained in the FS (and DFS) experiment are recorded in the form of force curves (see details in Section 1.1). During each experiment, different types of curves are usually obtained, since the protein deposition results in non-homogenous distribution of active protein molecules. As a result, randomly distributed force
curves, corresponding to either specific or non-specific intermolecular interactions1 are observed. Therefore, a special method of the force curve selection should be applied to separate the data regarding to the chosen interaction type. Both specific and non-specific interactions involve the formation of weak (tens of picoNewtons) non-covalent bonds. Therefore, the forces measured from the force curves are comparable for both interaction types and cannot be a criterion of selection. Fortunately, for different types of intermolecular interactions, the appearance of corresponding force curves differs to some degree. The curves matching a specific interaction type certainly have their own distinctive features. Nevertheless, it is a real challenge to recognize such characteristic features on each single force curve during the analysis of a whole FS dataset, containing hundreds or even thousands of single curves. To some extent, the use of automatic or semi-automatic computer software may precipitate the force spectroscopy data processing, but there is no robust algorithm developed so far. Still some novel approaches are expected.
In the present work, the novel experimental approach has been proposed to facilitate the selection of data obtained in the FS (and DFS) measurements of ligand-receptor interactions. The idea was to change the way of molecules deposition on a substrate surface. The newly proposed deposition method precisely demarcates between the surface region covered with the receptor molecules studied and the surface region where the molecules of interest are not present. Such approach enables the use of the latter region as a reference area (the FS and DFS data recorded in this area can be considered as the reference). The proper reference is a necessary element of each analytical method for the proper analysis and correct estimates of the studied effects. In the FS (and DFS) measurements, the introduction of the reference data
1 Specific interaction between two molecules occurs if the local surface structures of the molecules fit to each other in such complementary way that a large number of non-covalent bonds (ionic, hydrogen and van der Waals) could be formed, resulting in a strong intermolecular binding. Term “specific” means that a given type of receptor-molecule may interact in this way only with a defined type of ligand-molecule that possesses the proper shape, complementary to the structure of receptor binding site.
Non-specific interaction occurs via formation of non-covalent bonds of the same types (ionic, hydrogen and van der Waals) between the surface regions of molecules, showing no complementarity to each other.
allows the proper selection of the exact type of force curves characteristic for the interaction of interest (i.e. specific interaction between studied pair of molecules).
In order to deposit the studied receptor-molecules in a form of pre-defined pattern on the substrate surface, it was proposed to use one of the molecular patterning methods – the microcontact printing (µCP) technique. µCP is widely used to create molecular patterns, i.e. to transfer well defined amounts of a certain substance on geometrically well defined places of a substrate surface.
To demonstrate that the proposed combination of AFM with µCP facilitates the FS (and DFS) data analysis, this approach was applied to carry out studies of the intermolecular interaction between the chosen ligand-receptor pairs. The interaction of two lectins with their specific carbohydrate ligand was chosen to be studied, and the energy landscapes of the interaction potentials of both molecular pairs were to be constructed and compared. It was decided to choose such a pair of lectins that shares the carbohydrate specificity and binding site homology, but reveals slightly different affinities to their specific ligand. The case when such small differences are quantitatively distinguished by means of proposed combination of AFM with µCP would verify that the proposed approach is useful and perspective.
Connection of the work with scientific programs, plans and topics. The present work was performed in the confines of
i) the statutory activity of the Henryk Niewodniczański Institute of Nuclear Physics Polish Academy of Sciences (theme 5, task 7: “Investigations of biological, environmental and complex systems with the use of spectroscopic methods”);
ii) the 6th FP EU project No MRTN-CT-2003-503923 “Studies on cellular response to targeted single ions using nanothechnology” (CELLION);
iii) the NATO grant No LST.CLG.980477 “Molecular interaction in normal and cancer cells”.
Objectives and main tasks of the investigation. The main objective of the present research work is to improve the performance of the force and dynamic force spectroscopy experiments – to develop the procedure of reliable determination of the forces and energies that control the formation and dissociation of single molecular complexes. Partially, the objective of the work is to demonstrate that the combination of AFM and the microcontact printing technique facilitates the measurements (including data processing) performed using AFM working in the force spectroscopy mode.
The first task of the present work is to elaborate the protocol of the microcontact printing of proteins on a surface in a form of well-defined micrometer sized patterns. Distinctive districts of the patterns should contain distinctive types of immobilized molecules. Next steps are: i) to optimize the procedure of such pattern production (the second task) and ii) to verify the quality of the protein patterns with the special emphasis on the saving the biological activity of studied molecules (the third task). The fourth task is to demonstrate that the proposed way of protein deposition (i.e. the µCP technique) facilitates the data analysis of the FS and DFS measurements. Thus, the dynamic force spectroscopy measurements are to be performed for the chosen molecular pairs, using the produced molecular patterns as a substrate surface. It is important to underline how the used surface patterning facilitates the selection and the processing of the obtained force spectroscopy data.
The second objective of the work is to perform the comparative DFS study of interactions between one chosen type of ligand-molecule and two receptor-molecules revealing similar specificity, but different affinities to the ligand. On the base of the results of such DFS study, the difference is to be explored in the energy landscapes of dissociation pathways of two studied ligand-receptor complexes.
The third objective is to verify the obtained results in order to establish AFM as a standard technique that can be used for studies of molecules dissociation. Verification is to be performed by a complementary technique – the quartz crystal microbalance (QCM) that enables the study of association and dissociation of molecular complexes.
Research methods – the atomic force microscopy, the quartz crystal microbalance, the fluorescence microscopy.
Scientific novelty of the obtained results
- A novel approach, i.e. the combination of AFM with the microcontact printing technique, has been proposed and applied to facilitate the acquisition and the processing of the FS and DFS data obtained in the AFM measurements.
- The procedure of the µCP technique has been optimised, varying the ranges of used protein concentrations and applied times of substrate deposition on a surface.
- The DFS studies of the lectin-carbohydrate interaction between concanavalin A and high-mannose oligosaccharide chain of glycoprotein carboxypeptidase Y have been carried out. The dissociation rate constant and energy barrier positions obtained for the studied interaction were comparable with the data reported so far for dissociation of the concanavalin A-mannose molecular complex.
- For the first time, the DFS studies of the lectin-carbohydrate interaction between lentil lectin and its specific high-mannose oligosaccharide ligand (presented in the glycoprotein carboxypeptidase Y) have been performed. It has provided the dissociation rate constant and the energy barrier positions characterising the dissociation of the studied molecular complex.
- The comparative DFS study has been performed for two lectin-glycoprotein complexes (concanavalin A-carboxypeptidase Y and lentil lectin-carboxypeptidase Y). The difference in the energy landscapes of dissociation pathways of both molecular complexes has been shown and it has been related to the certain structural differences of the carbohydrate binding sites of the studied lectins.
- It has been demonstrated that results of the DFS measurements can be verified using the QCM technique; both methods gave the comparable values of the dissociation rate constant characterising the concanavalin
A-carboxypeptidase Y interaction.
- For the first time, the QCM studies of the binding reaction between immobilised concanavalin A and its mannose-type ligand have been carried out. The presented QCM measurements provided the values of association constant (Ka) comparable with the affinity of immobilized lectins to their
oligosaccharide ligands obtained using the surface plasmon resonance technique reported so far.
Practical significance of the obtained results
- The developed method of the conjunction of AFM and the microcontact printing technique could be successfully used for force and dynamic spectroscopy studies of ligand-receptor interactions, since µCP has no limitation for the type of biological molecule to be patterned. In addition, the conjunction of these techniques is recommended for force spectroscopy studies of ligand-receptor interactions, since it increases the reliability of the FS experiments.
- The optimised procedure of µCP can be successfully used to produce protein micropatterns that find applications in the biosensor technology and the biomedical area. Controlling the protein adsorption is critical to develop different bioanalytical micro-devices involved in several applications from the tissue engineering and the cell sorters to the purification and binding assays used in medicine.
- The presented possibility to transfer more than one type of proteins on a substrate surface in a form of pre-defined pattern may find applications in multi-component assay production, which enables simultaneous performance of a number of tests using one single testing substrate.
- The presented AFM and QCM measurements have used similar procedures of sample preparation and gave comparable values for the dissociation rate constants for studied reaction. It suggests that in future these two techniques can be successfully applied in simultaneous and complementary studies of a
chosen molecular interaction.
- Since the QCM studies have verified the high affinity of immobilised lectins to their specific carbohydrate ligand, the applied procedures of protein immobilization can be successfully used in future for analytical bioassay production.
Approvals of the results. The results included in the thesis were presented at five scientific conferences:
- Europhysics Conference “Workshop on Structure and Function of Biomolecules”, May 13-15, 2004, Będlewo, Poland
- Polish-Ukrainian conference “Dni nauki polskiej w Ukrainie”, June 21-25, 2004, Lvov-Kiev, Ukraine
- The Third Seminar "Badania prowadzone metodami skaningowej spektroskopii bliskich oddziaływań STM/AFM 2004", December 1-5, 2004, Zakopane, Poland
- International Symposium “Breaking Frontiers: Submicron Structures in Physics and Biology”, XL Zakopane School of Physics, May 20-25, 2005, Zakopane, Poland
- VIII Annual Linz Winter Workshop “Advances in Single-Molecule Research for Biology and Nanoscience”, February 3-6, 2006, Linz, Austria
Publications. The materials included in the thesis have been published in 5 scientific papers, including 3 publications in scientific profile journals [1-3], a chapter of the book “Condensed Matter: New Research” [4], and a conference proceeding [5]. The materials of the thesis are also presented in 5 abstracts to scientific conferences [10-14], 3 papers sent to scientific profile journals [6-8], and one paper in preparation [9].
Individual contribution. The above listed works of the author with co-authors contain the following contribution of the author: in [2-5, 7, 9-13] – the whole volume
of the experimental work, data processing, interpretation, and discussion of the results; in [1] – participation in the experimental work and discussion of the results; in [6, 8, 14] – participation in the discussion of the results.
Structure of the thesis. The thesis is composed of the Introduction, five Chapters, Conclusions, and References. The total size of the thesis is 119 pages (including the main part of 100 pages). The thesis includes 42 figures and 5 tables. References (117 issues) take 11 pages.
CHAPTER 1
LITERATURE REVIEW
The literature review presents short descriptions of the main techniques used in this work, i.e. the atomic force microscopy with its force spectroscopy and dynamic force spectroscopy modes and the microcontact printing technique. One section describes the lectin-carbohydrate recognition phenomenon. The last two sections of the literature review are dedicated to two auxiliary methods, the quartz crystal microbalance and the fluorescence microscopy, applied in the work mainly to verify the basic results obtained via the atomic force microscopy.
1.1. Atomic force microscopy (AFM)
1.1.1. Principle of AFM operation
An atomic force microscope belongs to a class of scanning probe microscopes that are primarily used for surface imaging. However, this technique is also widely used to investigate sample stiffness and to measure forces occurring during the interaction between two surfaces.
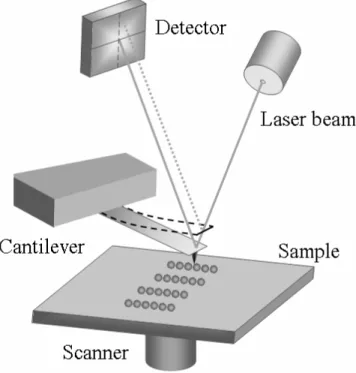
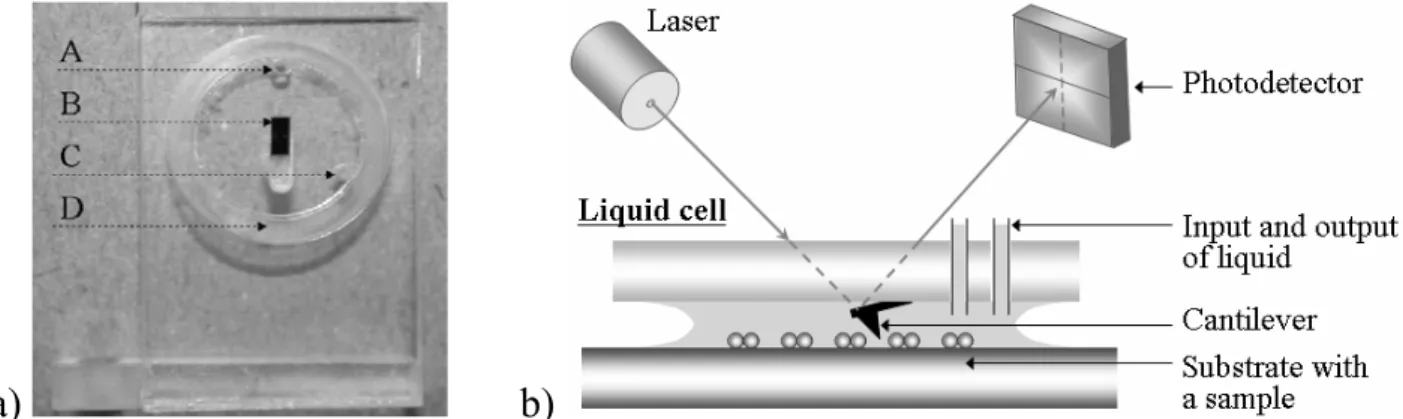
AFM investigates a sample surface with an AFM probe – a small tip mounted at the end of the elastic cantilever characterized by a given spring constant (Fig. 1.1). In order to obtain the surface topography, the AFM probe is placed in a close proximity to the surface and moved over it in a raster fashion (in some microscopes the cantilever position is stationary, while the sample is placed on a movable piezoelectric stage). The forces acting between the tip and the investigated surface cause the deflection of the cantilever. The deflection is monitored by the optical system composed of a laser and a position sensitive detector (PSD, a photodiode with an active area usually divided into four quadrants). The incident laser beam is focused at the end of the cantilever, while the reflected beam is located on the PSD active area. When the cantilever with the AFM tip is far away from the investigated surface (the interacting forces are negligible), all signals from four PSD quadrants are set to be equal. When the AFM tip touches the surface, the forces causing the cantilever deflection perpendicular to the surface change the position of the laser beam and lead to the increase of difference of signals registered on the upper and bottom quadrants of the PSD. The forces causing the cantilever deflection in the plane parallel to the investigated surface (friction forces) lead to an increase of difference between the signals from the left and right quadrants of the PSD. The recorded cantilever deflections are digitally processed and used to construct the contour of the studied surface or to estimate the forces acting between the probe and the surface.
AFM measurements can be carried out either in air, vacuum, or liquid medium. There are several broad reviews describing the application of AFM to study the surface topography (Morris et al., 1999, Cappella and Dietler, 1999, Reich et al., 2001, Fotiadis et al., 2002) and sample stiffness (Hoh and Schoenenberger, 1994; Cappella and Dietler, 1999; Vinckier and Semenza, 1998; Lekka et al., 2005). Taking into account that the present thesis is mainly dedicated to the determination of the forces acting between single molecules, only the force spectroscopy mode of AFM is discussed below.
1.1.2. Force spectroscopy (FS)
The capability to measure intermolecular forces with the resolution down to the tens of picoNewtons makes the force spectroscopy one of the most promising tools for biological applications, since it can provide the determination of the unbinding forces involved in recognition phenomena lying in the base of the protein-protein, protein-cell, or substrate-enzyme interactions (Zhang et al., 2002; Li et al., 2003; Touhami et al., 2003 Microbiology; Hinterdorfer et al., 1996; Evans et al., 2001). Such measurements require one type of molecules attached to the AFM probe and another, complementary one, immobilized on the substrate surface. The great advantage of AFM is that all measurements can be performed in liquid, under conditions close to physiological ones, without the need of molecule labelling.
In the force spectroscopy, the cantilever is moved towards the surface until it touches the surface with a given maximum force and then it is withdrawn. The cantilever deflection
∆x induced by the forces acting between the end of the AFM tip
and the sample surface is recorded as a function of the relative sample position set by the displacement of the piezoelectric scanner. Next, the cantilever deflection∆x is
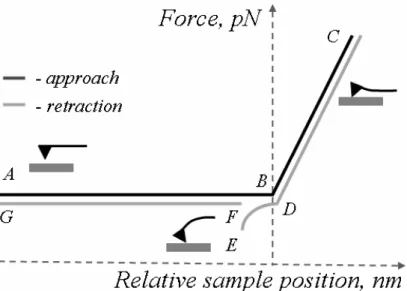
converted into the force value according to the Hooke’s law: F = kc ∆x, where kc is acantilever spring constant. The obtained plot of the force versus the relative sample position is called a force curve (Cappella and Dietler, 1999). Fig. 1.2 depicts the force curve typical for the interaction between a ligand-modified AFM tip and a receptor-modified surface.
Each force curve is composed of two parts: the one recorded during the AFM probe approaching the surface and another one collected during its withdrawal. As it can be seen in Fig. 1.2, when the AFM probe with the attached ligands is far from the surface with the receptor-molecules, forces acting between the probe and the surface are negligible (no interaction occurs), and the cantilever does not bend (Fig. 1.2, region A-B).
Fig. 1.2. The illustration of the force curve characteristic for the interaction of the ligand-modified AFM probe with the receptor-modified surface. To avoid overlapping of the approach and retract parts of the curve the force scale of the latter part was slightly displaced.
At the point B (i.e. the contact point), the AFM tip touches the surface and then the cantilever starts to bend due to repulsive forces (Fig. 1.2, region B-C). At the moment when the cantilever deflection reaches a certain predefined maximum value (point C), the automatic retraction starts. During further retraction (region C-D) the deflection of the cantilever decreases overlapping the trace B-C. If any prolonged interaction occurs between the ligands on the AFM probe and receptor molecules on the surface, then the attractive forces cause the cantilever deflection towards the surface (region D-E). When the cantilever spring constant exceeds the force gradient of the bonds, the AFM probe detaches from the surface, i.e. bonds holding the cantilever attached to the surface receptors are broken (point E). At this moment, the cantilever returns abruptly to its initial position (point F). In such a way, if any bonds are formed between the cantilever and the substrate surface, a characteristic peak (region D-E-F) occurs in the retraction part of the force curve. During further retraction cantilever oscillates around its free position (region from F-G).
By analyzing the curve recorded during the retraction, a force needed to detach the ligand-functionalized AFM probe from the receptor-modified surface can be determined. It is defined as a difference between the maximum adhesion force (point E) and the zero-force level (horizontal lines A-B or F-G).
The analysis of a single force curve gives very local information about the studied ligand-receptor interaction, i.e. at the given position on the studied surface. Knowing the surface coordinates of each recorded curve, the map of the interaction forces over the investigated surface can be obtained giving the spatial distribution of active receptors on the surface.
In practice, a large number of force curves has to be collected, since the probability of recording the interaction of interest between the studied pair of molecules is not very high. It comes from the random distribution of receptor-molecules deposited on a substrate surface and from the presence of other types of molecules interacting with the ligand on the AFM tip.
Thus, during each force spectroscopy measurement, a large number of force curves of different types are obtained. The curves matching the specific interaction of interest should be segregated from those related to non-specific ones. Since the formation of the specific molecular complex2 between two molecules involves several types of intermolecular interactions (e.g. electrostatic attraction, hydrogen bonding, dispersion interaction, hydrophobic forces), the unbinding of such molecular pair has a complex character. Therefore, the retraction part of the curve recorded while specific complex unbinding has the adhesive peaks of a characteristic shape with a non-linear region D-E, corresponding to the gradually growing force followed by vertical E-F region (see Fig. 1.2).The presence or absence of such distinctive peaks is used as a criterion to attribute a given curve to those appropriate to specific or non-specific interaction, respectively.
Different scientific groups use diverse methods to select force curves characteristic for a certain studied interaction type from the whole data set. Utilization of automatic or semi-automatic computer procedures only precipitates the force spectroscopy data processing (Kasas et al., 2000, Gergely et al., 2001). However, the proper selection of the force curves belonging to a given interaction
2 Here and after a term specific molecular complex was used to define the complex between a pair of molecules specific to each other or a complex of a binding site of a receptor-molecule and its specific ligand in the case if the receptor-molecule had more than one binding site to its ligand.
type still remains a challenge. Therefore, novel approaches for solving this problem are of great importance (see Chapter 4).
Processing of the whole set of the force curves collected for a given ligand-receptor pair gives the most probable unbinding force f* as a maximum of the Gaussian distribution fitted to the histogram of measured force values. These values are used in the dynamic single-molecule force spectroscopy to picture the energy landscape of the studied molecular complex dissociation.
1.1.3. Dynamic force spectroscopy (DFS)
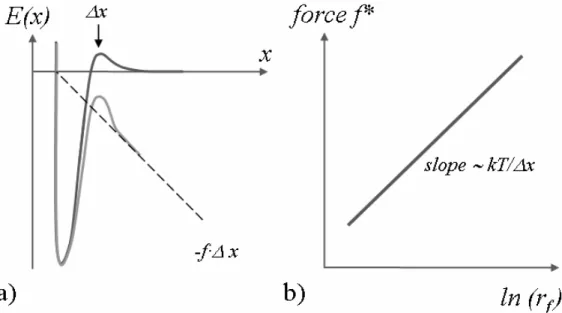
The unbinding of molecular complexes performed by means of AFM can be considered as a force-induced dissociation. However, in the absence of external force a bond failure is a statistical process. Each isolated single bond that contributes to the formation of a molecular complex has an intrinsic lifetime defined as a time elapsing from the bond formation till its spontaneous, thermally driven dissociation. In terms of the transition state theory, each molecular complex that undergoes dissociation can be characterized by an interaction potential defined along the reaction coordinate3 (Fig. 1.3a).
The molecular complex system having the energy (i.e. activation energy) sufficient to overcome the energy barrier of interaction potential passes from the bound (lower energy) to the unbound (higher energy) states via the transition state (i.e. maximum of the energy barrier).
The energy landscape of the thermally driven dissociation (Fig. 1.3a) can be described using the intrinsic dissociation rate kdiss0. According to Kramer’s theory
(Kramer 1940), the molecular complex is considered as a point of gravity trying to cross the potential energy barrier in attempts with frequency ν0. The dissociation
kinetics of such a system does not depend on a shape of the interaction potential, but
2 Reaction coordinate (x) – is a geometric parameter that changes during the conversion of a reactant molecular entity into one (or more) product molecular entities and whose value can be taken for a measure of the progress of an elementary reaction (for example, a bond length or bond angle or a combination of bond lengths and/or bond angles; it is sometimes approximated by a non-geometric parameter, such as the bond order of some specified bonds).
on the height of the energy barrier U0 ⎟ ⎠ ⎞ ⎜ ⎝ ⎛− = kT U kdiss 0 0 0
ν
exp , (1.1)where k denotes the Boltzmann constant, and T is the temperature in Kelvins.
Under the externally applied force f, the energy barrier is reduced by -f
∆x
(Fig.1.3a, dotted line), what consequently modifies the dissociation rate kdiss( )
⎟ ⎠ ⎞ ⎜ ⎝ ⎛− − ∆ = kT x f U f kdiss 0 0expν
, or (1.2)( )
⎟ ⎠ ⎞ ⎜ ⎝ ⎛ ∆ = kT x f k fkdiss diss0 exp
, (1.3)
where
∆x is a position of the energy barrier – a distance between the maximum and
minimum of the interaction potential, and kdiss0 is considered as a dissociation rateconstant – the dissociation rate under f = 0. For the first time the relationship (1.3) was reported by Bell in 1978 (Bell 1978).
Fig. 1.3. a) Schematic plot of the energy landscape of the thermally driven (dark grey line) and the force-induced (light grey line) dissociations; b) schematic plot of the most probable unbinding force
f* versus logarithm of the loading rate rf. A linear region corresponds to one energy barrier with one
transition state, as the one presented in Fig. 1.3a. The figures are according to Evans and Ritchie (1997).
Later on, in 1997 Evans and Ritchie extended the Bell model for the dynamic force spectroscopy experiments (Evans and Ritchie 1997), where the applied external force was assumed to change linearly with time: f = rf ·t. The parameter rf reflecting
the rate of the force alteration in time is termed a loading rate. Using the equation of the probability density N(t) of a molecular complex dissociating under the force f at the moment t
( )
k r t N( )
t dt t dN f diss( ) − = , (1.4)Evans and Ritchie have deduced the important linear relationship between the most probable force f* causing the unbinding of molecular complex and the applied loading rate rf x kT k r x kT f diss f ∆ ∆ = 0 ln * . (1.5)
In the DFS measurements, the values of the most probable unbinding forces are determined and plotted versus the corresponding loading rate values (Fig. 3b) in a wide range (several orders of magnitude) of loading rates. By fitting Eq. 1.5 to the experimental data, the Bell model parameters, such as a dissociation rate constant kdiss0 and a position of the energy barrier
∆x, are determined and used to characterize
the dissociation of the studied molecular complex.
The first DFS measurements were carried out for avidin-biotin and streptavidin-biotin complexes (Merkel et al., 1999). The interest in this model system came from its high affinity and specificity of the interaction and the availability of structural and biophysical data. The dissociation pathway of this complex was found to overcome the multiple energy barriers manifested in the presence of distinct linear regions visible in the plot of the unbinding force versus the loading rate. Several kdiss0 and
∆x
values attributed to sequential energy barriers present in the dissociation pathways were obtained for other molecular complexes, such as streptavidin and biotin (Yuan et al., 2000), leukocyte function-associated antigen-1 and intercellular adhesion molecule-1 (Zhang et al., 2002), α5β1 integrin and fibronectin (Li et al.,
2003), selectins and glycoproteins (Fritz 1998, Evans et al., 2001).
As regards the lectin-carbohydrate recognition phenomena, several examples of the DFS studies can be found in literature (e.g. Dettmann et al., 2000, Chen and Moy 2000). Chen and Moy reported the Bell model parameters for the dissociation of the lectin concanavalin A (Con A) from the mannose-linked agarose bead. For Con A-mannose complex only one linear region was observed in the plot of the unbinding force versus the loading rate. Dettmann et al. (2000) have analyzed the separation of the lactose and the lactose-composed chains of asialofetuin (ASF) from three lectins (Ricinus communisagglutinin, RCA; Viscum albumagglutinin, VAA; galectin-1 from bovine heart, BHL). They determined the Bell model parameters and also showed that only one linear region was visible in the plot for all studied lectin-carbohydrate complexes.
Dettmann et al. studied three lectins of similar ligand specificities, but not the binding site homology. They managed to show the distinct shapes of the energy landscape related to the removal of the same type of ligand from the binding pockets of studied lectins.
In the present study, it was decided to focus on one type of sugar ligand and a pair of lectins sharing the ligand specificity and binding site homology but revealing different affinities to their specific sugar ligand. The goal of our studies was to check if the difference in the energy landscapes of dissociation of such two lectin-carbohydrate complexes would be detectable via the DFS measurements.
1.2. Microcontact printing (µCP) technique
As mentioned above, the DFS measurements were chosen to study two different receptor molecules possessing similar specificity but different affinity values to the same ligand. Taking into account that the expected differences of such similar molecular complexes might be small and hardly detectable, the DFS measurements should be performed with a particular precision. Thus, the proper segregation of the DFS data should be performed in order to exclude all the force curves corresponding
to any other type of interaction except the studied interaction of interest. For this purpose, a novel approach is proposed to be applied to improve the FS and DFS data acquisition and processing. It is proposed to perform the (dynamic) force spectroscopy measurements in combination with patterning of studied receptor-molecules on the substrate surface. In such a way, the strict control of the locations of the receptor molecules of interest can be achieved giving the possibility to extract the data corresponding to these locations.
Below, a short introduction is presented about the way of surface modification used in the AFM measurements and the methods of protein patterning. The focus is set to one of the patterning methods, i.e. the microcontact printing, since it is highly suitable for the AFM technique.
1.2.1. Surface modification
The force spectroscopy measurements require one type of molecules attached to the AFM cantilever and the complementary one immobilized on the substrate surface. Molecules can be attached to the surface via physical adsorption, affinity binding, or covalent binding (Zhu and Snyder, 2003). Each of the methods has its advantages and disadvantages and should be chosen in conformity with a given application.
For the AFM measurements, the covalent binding of the studied molecules to a surface is one of the most suitable methods. The interactions acting in a ligand-receptor complex (hydrogen bonds, van der Waals force, hydrophobic interactions etc.) have the strength less than 1 nN, while covalent attachments have bond unbinding forces in excess of 1 nN (Grandbois et al., 1999). Therefore, probing the covalently immobilised layer of receptor-molecules with an AFM tip with covalently attached ligands, one can be confident that the measured unbinding forces are not due to the proteins being removed from both the tip and the substrate.
However, such way of immobilization results in molecules randomly oriented on the surface and only a fraction of molecules would have their active sites turned towards the probing tip. In addition, the covalent binding may disturb the quaternary and/or the tertiary structures of proteins, which may lead to the loss of the biological
activity of proteins. Both these possibilities should be taken into account when a force spectroscopy experiment is to be carried out and when the experiment results are to be analyzed.
1.2.2. Protein immobilization via covalent cross-linking
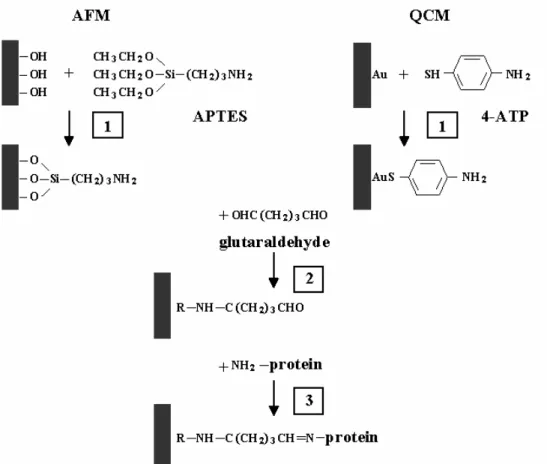
The cantilevers used in AFM measurements are usually made of silicon or silicon nitride. As a substrate for protein deposition the glass coverslips (or mica) are used. In aqueous solutions, all these materials contain hydroxyl groups. The following reactions take place on a silicon nitride surface in water (Senden and Drummond, 1995):
Si3N + H2O –> Si2–NH + Si–OH (1.6)
Si2 –NH + H2 O –> Si–NH + Si–OH (1.7)
Si2 –NH2 + H2 O –> NH3 (aq) + Si–OH (1.8)
Similarly, glass, mica, and silicon surfaces immersed in water have hydroxyl groups too
SiO2 + 2H2 O –> Si(OH)4 (1.9)
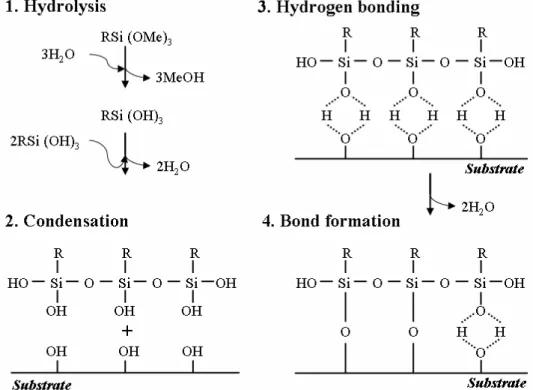
Therefore, the same approach can be used for the chemical pre-modification of these surfaces. The silanization process, i.e. the reaction with alkosilanes, can be used as a first step of the chemical modification. Alkoxysilanes after prehydrolysis (Eqs. 1.10, 1.11) readily react with glass and silicon nitride surfaces (Eq. 1.12) according to Plueddemann (1982)
R′ Si(OR)3 + H2 O –> R′ Si(OR)2 OH + ROH (1.10)
R′ Si(OR)2 + HOSi≡ –> R′ Si(OR)2 OSi≡ + H2 O, (1.11)
R′ Si(OR)3 + HOSi≡ –> R′ Si(OR)2 OSi≡ + ROH, (1.12)
where HOSi can be either an isolated surface silanol or a silicon-bonded hydroxyl group. R is typically an ethyl or a methyl group. R
′
is a chemical group that reacts either with a cross-linking agent or directly with a molecule (i.e. protein). For instance, for most often used alkoxysilane (3-aminopropyltriethoxysilane, APTES), R denotes the ethyl group and R' – the amino group which readily reacts with aldehydes. Therefore, protein immobilization on the amino-functionalized surface isoften realized using glutaraldehyde (or glutaric aldehyde) as a cross-linking agent. Each molecule of the glutaraldehyde contains two aldehyde groups (CHO). During its deposition onto silanized surface, one of them reacts with the amino groups of alkosilanes and another one with amino groups belonging to a protein, according to “Shiffs bases” reaction
R1 – CHO + H2N – R2 –> R1 –CH=NR2 + H2 O (1.13)
Since glutaraldehyde is very reactive, the efficient passive protection of the surfaces is required after the protein immobilization. It is usually performed by blocking the free aldehyde groups using other proteins, e.g. bovine serum albumin (BSA). This procedure is called a backfilling.
1.2.3. Spatially controlled immobilization of biomolecules
The orientation of the layers of immobilised molecules on a surface in a pre-defined pattern is critical in developing the biosensor microdevices and analytical bioassays, in tissue engineering, and in cell sorting microdevices. Moreover, it allows a selective attachment of cells to the patterned surface, which is of great importance in the biomaterials field. Initial work in protein patterning was performed by Kleinfeld et al. to manipulate the motion of neurons (Kleinfeld et al., 1988).
Nowadays, a number of techniques such as photolithography (PL), electron beam lithography (EBL), finely focused ion beam lithography (FFIBL), scanning probe lithography (SPL), dip-pen lithography (DPL), and microcontact printing (µCP) are used to produce the spatially controlled patterns of molecules on inorganic surfaces (Bauch et al., 1995; Lee et al., 2004; Morgan et al., 1995; Piner et al., 1999; Michel et al., 2001). Biological molecules immobilised on patterned inorganic substrates would be spatially oriented too. The direct patterning of biomolecules on surfaces can be performed via either the microcontact printing or the dip-pen lithography (Bernard et al., 1998; Michel et al., 2001; Piner et al., 1999). These methods are responsible only for the physical transfer of molecules onto the surface. The strength of coupling of these molecules depends on the chemical pre-modification of the surface.
1.2.4. Microcontact printing technique
The microcontact printing (µCP), termed also as a soft lithography, is a technique applied to produce the well defined patterns of molecules on different substrate surfaces with the use of a polymeric stamp made of poly(dimethylsiloxane) (PDMS). Poly(dimethylsiloxane) is easy handled and moulded material. Hardened PDMS seals reversibly to smooth plastic or glass substrates. The µCP technique is flexible in pattern size and form. Usually it is used to produce micrometer scale patterns on surfaces. However, some scientific groups have reported the deposition of patterns from a couple of hundreds down to even a few nanometres wide (Li et al., 2002; Li et al., 2003).
PDMS conforms to surface features at the micron scale and, when hardened, it releases from the master without damaging its surface. This property makes it suitable for replication of high-quality patterns and structures of submicron sizes. It is optically transparent, which enables the study of closed structures by the standard light microscopy. PDMS is suitable for patterning of biological molecules, since it is inert towards aqueous solutions with pH ranging from 1 to 12. It may also resist a short contact with some reactants that swell, dissolve, or corrode.
The schematic view of the PDMS pattern formation is presented in Fig. 1.4 (items 1-3).
Fig. 1.4. Schematic view of the PDMS stamp fabrication (steps 1-3) and principles of the microcontact printing with a PDMS stamp used to translate a protein pattern on a substrate surface (steps 4-6).
The PDMS stamp is moulded as a replica from the silica master having a given pattern on its surface. In order to form PDMS, the siloxane base oligomers are polymerised by a crosslinking oligomer. Polymerization can be carried out at room temperature (McDonald et al., 2000; Branham et al., 2002), but sometimes the heat is used to accelerate it. To produce a stamp, a liquid polymer is poured over a silicon master with a given pattern and it is left to harden. After its hardening, the stamp is peeled off the master.
The prepared PDMS stamp of a desired pattern is then used for the molecule deposition on a surface of the chosen substrate (Fig. 1.4, items 4-6). At first, the stamp is dipped into the solution containing protein molecules. After several minutes, the stamp is brought into contact with the substrate surface. Softness of PDMS allows the polymer to adhere and hold the substrate in contact, occlusively sealing the surface. Since the PDMS surface is hydrophobic, during its withdrawing from the surface the molecules remain attached on the surface. Both the silicon wafer used as a mold and the PDMS stamp are reusable.
To sum up, molecular patterning methods permit to transfer small amounts of a certain substance (or even several types of molecules) on geometrically well defined areas on a micrometer substrate surface. Therefore it can be applied in production of microarrays for the use in the biomedical area. Such microarrays enable fast and easy performing hundreds of tests with one single testing plate. Moreover, molecular patterning provides the conditions for the minimalization of substrate surface size, for the saving of the used biological material, and increase of either selectivity or sensitivity of the assay.
In the present work, it was reasonable to choose such a method of protein patterning that uses common laboratory supplies and less expensive materials. In the light of these demands, the microcontact printing has been chosen as the low cost and easy handled one among other patterning methods. The protein patterns produced via µCP were further used as a substrate surface for the force spectroscopy measurements.
1.3. Lectin-carbohydrate interaction
Carbohydrates are a large group of molecules, which includes either simple sugars (monosacharides) or oligosaccharides and polysaccharides. Carbohydrates are present either on a surface of cell membranes or in cytoplasm covalently attached to proteins and lipids forming glycoproteins and glycolipids, respectively.
In living systems, carbohydrates are both structural components and a source of nutrients. In addition, due to their great potential to form the structures more variable than nucleic acids or proteins, carbohydrates participate in mediating immunological and intercellular signalling processes, where the variety of molecular structures of mediator-molecule is important to form the specific host defence or to transport the specific signal from one group of cells to another. A lot of important molecules such as structural proteins, enzymes, or cell adhesion molecules possess carbohydrates in their structure.
Lectins are proteins that recognize different types of carbohydrate structures with specific binding affinities comparable with those observed for enzyme-substrate or antigen-antibody interactions. Lectins interact with carbohydrates through hydrogen and metal coordinated bonds, van der Waals, and hydrophobic interactions. Though the binding between these molecules is specific, in most cases it is characterised by low energetic changes with dissociation constants in the milimole range.
Lectin-carbohydrate interaction can be found in a wide variety of biological processes, such as cell adhesion and migration, phagocytosis, infection, host defence, embryogenesis and apoptosis (Sharon and Lis 1989, Ni and Tizard 1996). It is believed to be one of the basic biological recognition mechanisms (the others are protein-protein, protein-nucleic acid, and nucleic acid-nucleic acid interactions). Therefore, the fundamental value of studying the mechanism of lectin-carbohydrate interactions is evident. In respect of its practical application, this type of interaction is utilised in the purification of glycoproteins (Hampel et al., 1999), in the assays for identification of tumour cell lines, blood groups or cellular components (Song et al., 2003), etc. The development in these areas would contribute to new courses of
disease treatment or its prevention.
Objects of study. In the present work, two lectins – concanavalin A (Con A) from Canavalia ensiformis (jack bean) and lentil lectin (LcH) from Lens culinaris (lentil) – were under consideration. To study the carbohydrate-binding activity of Con A and LcH, a glycoprotein containing high-mannose oligosaccharide chain was chosen – carboxypeptidase Y (CaY) from Baker’s yeast.
Concanavalin A and lentil lectin. Both chosen lectins belong to the group of plant Legume lectins. For a long time, legume lectins were used as a model system to describe the protein-carbohydrate interactions, which aroused from their wide variety of binding specificities to carbohydrates and from the simplicity of their extraction and purification. The existence of extensive structural homologies has been shown among the Legume lectins such as proteins from jack bean, lentil, pea, soybean, peanut, and red kidney bean (Varki et al, 1999, Foriers et al., 1978, Loris et al., 1993). Both concanavalin A (from jack bean) and lentil lectin, just like other legume lectins, have one sugar-binding site per monomer. Their sugar-binding sites contain tightly bound calcium and manganese ions, which keep the amino acid residues of the site at the required positions, essential for sugar binding. Con A and LcH specifically recognize carbohydrates containing α-D-mannose or α-D-glucose residues.
Con A is a dimer (at pH 4.5–5.6) or tetramer (at pH above 7) composed of a single polypeptide subunit (237 amino acid residues, 26500 Da, PDB entry 1CVN). LcH is a dimer of two subunits each containing two non-covalently bound polypeptide chains (α-chain, 52 amino acid residues, 6000 Da; and β-chain, 181 amino acid residues, 18000 Da, PDB entry 2LAL). The structural similarities of these lectins were reported by the primary structural analyses and X-ray crystallographic studies. The folding of the polypeptide chains in the region of the carbohydrate-binding sites is similar, despite some differences in the primary sequences (Foriers et al., 1978). However, Con A and LcH exhibit different binding affinities for saccharide derivatives of the mannopyranoside and glucopyranoside configurations (Goldstein et al., 1965; Debray et al., 1981).
the ligand specificity and binding site homology (Bradbrook et al., 1998; Loris et al., 1994), but revealing different affinities to their specific sugar ligands (Schwarz et al., 1993; Schwarz et al., 1996). Studies of the Con A and LcH interactions with carbohydrates are important to find out if the differences in their carbohydrate binding properties are related to some structural differences of the sugar binding sites of these lectins.
Carboxypeptidase Y. Carboxypeptidase Y (CaY) from Baker’s yeast is an enzyme from the family of serine proteases, catalyzing the hydrolysis of peptidyl-L-amino-acids. It exists as a monomer containing a single polypeptide chain (421 amino acid residues, 61000 Da) and four asparagine-linked oligosaccharide chains (Dumoulin et al., 1999). The carbohydrate moiety of CaY accounts for about 15% of the protein molecular mass and is composed of mannose residues. A carbohydrate composed of mannose monosaccharides only is termed high-mannose oligosaccharide or high-mannose glycan (Varki et al, 1999). As most of peptidases, CaY is highly resistant to changes of the environmental conditions (pH, temperature) (Shimizu et al., 1999). Unlike other types of carboxypeptidases, CaY contains no metal ions; therefore it was chosen for studies of lectins, which are sensitive to the presence of metal ions (Johansen et al., 1976).
1.4. Quartz crystal microbalance (QCM)
The quartz crystal microbalance (QCM) has been widely used to measure deposition rates in gas phase and vacuum since 1959 when Sauerbrey has introduced the relationship between changes in a resonant frequency of a quartz crystal and a mass accumulated on it (Sauerbrey et al., 1959). Simultaneously, the QCM applications in liquid conditions have been developed (Konash and Bastlaans, 1960; Bruckenstein and Shay, 1985; Kanazawa and Gordon, 1985). However, in liquid solution, the resonant frequency of quartz is affected by both mass deposited on the crystal and viscoelasic properties of the surrounding solution. Kanazawa and Gordon showed that the change of the resonant frequency is proportional to the square root of
the liquid’s density-viscosity product (Kanazawa and Gordon, 1985). The characterization of the quartz resonator behaviour under simultaneous mass and liquid loading have been reported in many publications (Muramatsu et al., 1988; Martin et al., 1991; Voinova et al., 2002) though a theory of QCM operating in liquid phase is still incompletely developed. Despite that, there is an increasing number of papers concerning the QCM measurements in liquid, especially those relevant to biological applications such as immunoassays (Lin et al., 2000; Pan and Shih, 2004; Kurosawa et al., 2004), biosensor technique (Rickert et al., 1997; Lau and Shao, 2000), monitoring kinetics of the adsorption-desorption processes (Mao et al., 2002), monitoring the DNA hybridization (Okahata et al., 2000; Cho et al., 2004), and studying the problems of molecules immobilization (Cho et al., 2004; Caruso et al., 1996; Coffey et al., 2001).
The QCM studies of the interaction kinetics of biological molecules. As mentioned above, QCM enables the on-line monitoring of the kinetics of the studied ligand-receptor binding. Moreover, it allows estimating the quantitative parameters characterising the kinetics of studied molecular interaction, namely the association (kass0) and dissociation (kdiss0) rate constants and the association constant (affinity, Ka)
(Mao et al., 2002; Okahata et al., 2000; Hu et al., 2003). In the reversible biomolecular interaction in solution, ligands and receptors form ligand-receptor complexes. Two rate constants (kass0 and kdiss0) related to association and dissociation
describe the rates of binding and unbinding of molecules. A similar reaction occurs when receptor molecules are immobilized on a surface of the quartz. In such a case, the percentage θt of ligands bound to receptors present on the quartz surface at a
given time t after the injection of ligands to solution is given by the equation
( )
(
1 t)
eq
t =θ 1−e− τ ⋅
θ , (1.14)
where τ is a relaxation time, θeq is an equilibrium percentage of bound ligands.
The relaxation time τ is related to the initial ligand concentration by the following equation 0 diss ligand 0 ass 1 =k ⋅C +k − τ , (1.15)
where τ-1 is known as the relaxation rate constant. Both association and dissociation rate constants are present in this relationship.
The equilibrium percentage of bound ligands θeq corresponds to the maximum
percentage of ligand-receptor complexes present on the surface at the end of the reaction. Evidently, the increase of θt results in a proportional rise of the quartz
crystal mass
( )
(
1 t)
max t m 1 e m =∆ − − τ ⋅ ∆ . (1.16)When the mass changes are small enough and they do not alter significantly the viscoelastic properties of the quartz resonator surface, then it can be assumed that they are proportional to the frequency shift. Thus,
( )
(
1 t)
max t f 1 e f = ∆ − − τ ⋅ ∆ . (1.17)Equation 1.17 is widely used for a two-step determination of kinetic parameters describing the binding process (Mao et al., 2002; Okahata et al., 2000; Ebara and Okahata; 1994, Hu et al., 2003). In the first step, the frequency shift is recorded by QCM as a function of time for different concentrations of the added ligand. From these data, the relaxation time τ, corresponding to given concentration, is obtained. Using the dependency of the relaxation rate constant τ-1, defined as an inverse of the relaxation time τ, on the ligand concentration (Eq. 1.15), the association (kass0) and
dissociation (kdiss0) rate constants are determined. The association constant (Ka) is
estimated as a ratio of the association and the dissociation rate constants: Ka=kass0 / kdiss0.
Justification of the QCM application for the present study. The main method used in the present work was the atomic force microscopy applied in the FS and DFS modes which provide a certain kinetic parameter – a dissociation rate constant, characteristic for the studied lectin-carbohydrate interaction. Since AFM is not a standard technique used for the reaction kinetics measurements, it was reasonable to verify the reliability of such measurements. For this aim a number of commonly used physical and biochemical techniques could be applied such as surface plasmon resonance (SPR; Homola, 2003), enzyme linked immunosorbent assay (ELISA;
Monroe, 1984), quartz crystal microbalance (QCM; O’Sullivan and Guilbault 1999), analytical affinity chromatography (HPLAC; Chaiken, 1986), affinity capillary electrophoresis (ACE; Linhardt and Toida, 2002) etc. In the present work, the quartz crystal microbalance has been chosen among these methods, since the QCM measurements could be performed using the native molecules without any labelling, in liquid environment, using the immobilized receptor molecules, just like in AFM measurements.
Moreover, the interaction between lectins (Con A) and their mannose- and glucose-containing oligosaccharide ligands have been already intensively studied using QCM. Primarily the studies of the interaction of free Con A molecules with immobilized oligosaccharides (Pei et al., 2005) or synthetic glycolipid membranes (Ebara and Okahata; 1994; Bakowsky et al., 2000; Mann et al., 1998) have been carried out. The QCM study between the immobilized Con A molecules and their mannose-containing ligands has not yet been reported. Such study was performed using surface plasmon resonance only (Mislovicova et al., 2002) and, when compared with the results of the above-mentioned works, it showed that the affinity of immobilized Con A to oligosaccharides could be lower than that of non-immobilized lectins. In order to verify this observation, in the present work, QCM was applied to determine the affinity of immobilized concanavalin A to its mannose-type ligand.
1.5. Fluorescence microscopy
The fluorescence microscopy employs a phenomenon that certain materials when irradiated with the light of a specific wavelength emit energy detectable as visible light (Trigg et al., 1995). Therefore, the method could be applied to study the samples that exhibit the fluorescence properties. The biological molecules can be fluorescing by its nature or can be labelled with fluorescing probes (fluorophores). Fig. 1.5 illustrates the basic components of a fluorescence microscope.
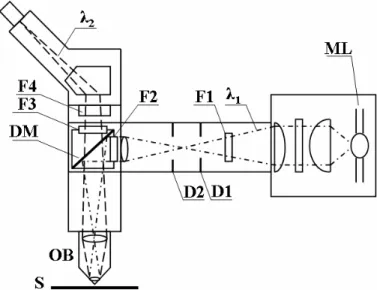
Fig. 1.5. Scheme of the basic components of a fluorescence microscope. The excitation light (λ1)
emitted from the mercury arc lamp (ML), passes through a collector lens system, the heart filter (F1, suppresses infrared wavelengths), the field and aperture diaphragms (D1 and D2) and then enters the emission filter (F2). The light is then directed through the objective by a special dichroic mirror (DM) onto the specimen (S). The dichroic mirror separates the excitation light from fluorescence. Secondary fluorescence (λ2), emitted by fluorophores residing in the specimen, travels
back through the objective (OB) and the dichroic mirror. Finally, it passes through an emission filter (F3), a barrier filter (F4) into the microscope eyepieces or camera system.
In the microscope, a sample is first irradiated with a specific band of wavelengths. The fluorescence emitted by the investigated sample is then separated from the much brighter excitation light and directed to the eye, the detector or the CCD camera. The fluorescence image corresponds only to the emitted light, while a much more intensive excitation light is suppressed. Therefore, the fluorescent structures in the image can be observed with a high contrast against a dark background. The fluorescence microscopy technique is an essential tool in materials science and biology, since it helps to reveal the presence of a given type of molecules on the substrate surface or in living cells. Using multiple fluorescence labelling, different types of molecules can be labelled and identified simultaneously.
In the present work, the fluorescence microscopy was applied to validate the quality of the protein patterns produced via µCP and also to verify the binding activity of patterned proteins after the deposition procedure.
1.6. Conclusions to Chapter 1:
1. AFM is a promising analytical technique, since it can provide the quantitative parameters characterising the kinetics of the dissociation of a single molecular complex. AFM working in the DFS mode has the preconditions to become a biosensor; however there is a strong necessity to make the DFS data processing faster, easier and more precise.
2. To improve the FS and DFS data acquisition and processing, the (dynamic) force spectroscopy measurements are proposed to be carried out in combination with patterning of studied receptor-molecules on the substrate surface. In such a way, the strict control of the locations of the receptor molecules of interest can be achieved giving the possibility to extract the data corresponding to the interaction of interest.
3. For patterning of proteins on a substrate surface, the microcontact printing can be used as it is a low cost and easy handled patterning method that uses common laboratory supplies and inexpensive materials.
4. Since protein patterning methods find a lot of various biomedical and biosensor applications, the modification and optimization of patterning procedures are of great importance.
5. Lectin-carbohydrate interaction is one of the basic biological recognition mechanisms playing the key role in a number of normal and pathological cellular processes. It finds the practical application in the biosensors and biomedical assays development, in the purification of glycoproteins, etc. This fact makes evident the usefulness of studies of lectin-carbohydrate interaction.
6. Two proteins, Con A and LcH, has been chosen as a pair of lectins sharing the carbohydrate specificity and binding site homology, but revealing different affinities to their specific carbohydrate ligand (high-mannose oligosaccharide chain of glycoprotein CaY). Making a comparative DFS study of two similar specific molecular complexes, such as Con A-CaY and LcH-CaY, it would be possible to verify whether the DFS mode of AFM enables the detection of small differences in the energy landscapes of the interaction potentials of studied molecular complexes.
7. On the other hand, the studies of the Con A and LcH interactions with carbohydrates may bring additional information that can be used in future to establish the relation between the differences in carbohydrate-binding properties of these lectins and small structural differences of their carbohydrate-binding sites.
8. Since AFM is not yet a widely-used method to study the specific ligand-receptor interaction, the required validation of its results can be obtained using a confirmatory technique – the quartz crystal microbalance, for instance.
CHAPTER 2
MATERIALS AND METHODS
2.1. Materials
Proteins. Concanavalin A from Canavalia ensiformis (Con A), lentil lectin from Lens culinaris (LcH), Con A labelled with fluorescein isothiocyanate (Con A-FITC), LcH labelled with tetramethylrhodamine isothiocyanate (LcH-TRITC), carboxypeptidase Y from Baker’s Yeast (CaY), and bovine serum albumin (BSA) were purchased from Sigma (Germany).
Reagents. 3-aminopropyltriethoxysilane (APTES) and 4-aminothiophenol (4-ATP) were bought from Sigma (Germany). Glutaraldehyde and Tris-buffered saline (TBS; 50 mM Tris-HCl, 150 mM NaCl, pH 7.6), were purchased from Fluka (USA). Glycine (aminoacetic acid) was purchased from ICN Biomedicals Inc. (USA). Hellmanex II was purchased from Hellma GmbH (Germany). Poly(dimethylsiloxane) (PDMS, Sylgard 184) was purchased from Dow Corning Co. (USA).
Proteins were solved in TRIS buffer saline (TBS) supplemented with 1mM of CaCl2, MnCl2 and MgCl2, since the presence of the metal ions is essential for carbohydrate-binding activity of lectins Con A (Agrawal and Goldstein, 1967, Schwartz et al., 1993) and LcH (Schwartz et al., 1993). All solutions were prepared using deionized water (Milipore Simplicity 185, 18.2 MΩ·cm).
2.2. Protein deposition
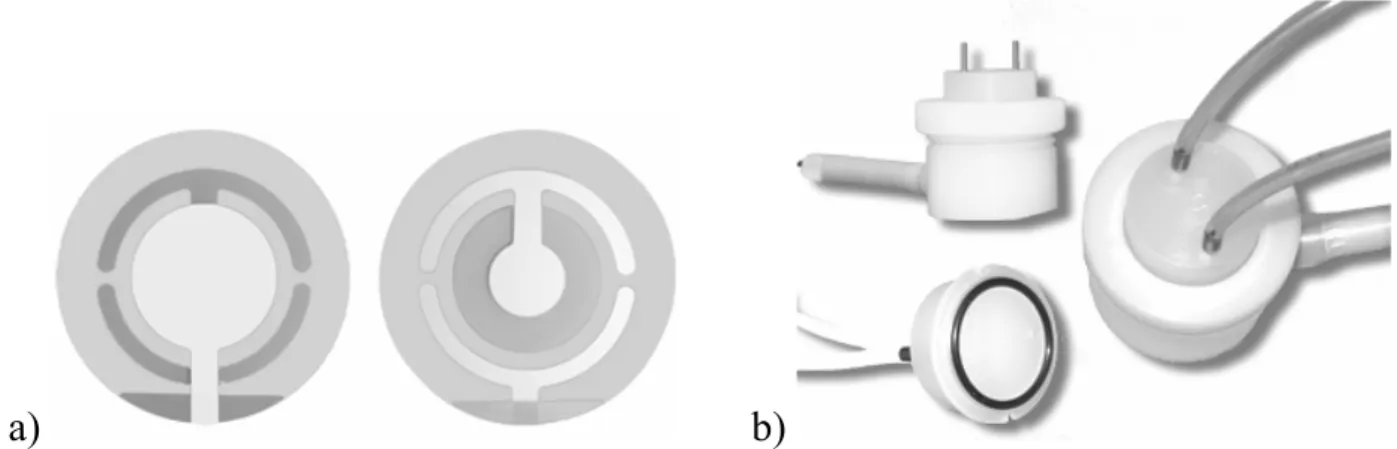
Proteins were immobilized on a surface of either glass coverslips, or silicon nitride cantilevers (for the AFM measurements), or on a surface of gold electrodes of the quartz crystal utilized (for the QCM measurements). Figure 2.1 presents the schematic illustration of the procedures for the glass (silicon nitride) and the quartz surface modifications.