MODELLING FATALITIES OF ROAD ACCIDENTS
IN NIGERIA
Buliaminu Kareem*, Peter Kayode Oke* and Ayodele Salami Lawal*
* Department of Mechanical Engineering, Federal University of Technology, Akure, P.M.B. 704, Akure, Ondo State, 34001, Nigeria,
Email: karbil2002@yahoo.com Email: okekayode2002@yahoo.com
Email: lawal_salam@yahoo.com
Abstract Preponderance of road accidents is one of the major causes of death in Nigeria, but the fatality of these accidents is unknown. In this study, data on casualties of the road accidents in Nigeria are collated, statistically analysed and modelled for predicting fatality of the accidents. The strategies of minimising rise in fatality of road accidents were proposed. The results obtained showed that the fatalities of the road accidents have polynomial relationships with the population of the road users, or time. The highest annual accident fatality probability of 0.17 was obtained over the total population of the road users. The result from combined modelling of traffic population and time showed that the accident fatalities will rise in future unless roads and drivers are well cultured. The findings would be useful for demographers, safety and health workers in their planning.
Paper type: Research Paper Published online: 30 July 2012
Vol. 2, No. 3, pp. 259-271 ISSN 2083-4942 (Print) ISSN 2083-4950 (Online)
© 2012 Poznan University of Technology. All rights reserved. Keywords: Traffic, population, road accidents, fatalities, regression
1. INTRODUCTION
Deaths from road traffic accidents in Nigeria were ranked among the highest in the world (Adeniyi, 1985). Accidents can occur at any traffic speed, but fatality of these accidents differs, depending on the speed at which they occur. The contri-bution of death resulting from road traffic accident to total death rose from 38.9% in 1967 to 58% in 1974 (Adeniyi, 1985). Vehicular crashes have gotten to an unbearable level that road accidents must be attacked with all seriousness in order to minimize its fatality. In a bid to combat road accident in Nigeria, many efforts have been made by the government since 1913 with the establishment of Federal
Road Safety Corps (FRSC) (Adeniyi, 1985). FRSC was charged with the
respon-sibility of maintaining safety on Nigeria roads.
Globally, highway safety institutes were established to find ways of preventing motor vehicle crashes (FHWA, 2006). Findings have shown that human, vehicular, and environmental factors were the major causes of accidents on roads (Flaherty, 1974). Many vehicular institutes were equipped with a state-of-the-art crash test facility (ITE, 1999); (MTC, 2005). Data on types of vehicles mostly involved in crashes are available in literature (pubhealth, 2010); (Forthepeople, 2010). Drivers’ nonchalant attitude on roads has been identified as the major cause of accidents in some quarters (JRA, 1969); (McMahon, Zegeer, Duncan, Knoblauch, Stewart & Khattak, 2005); (Hawkey, Henson, Hulse & Brindle, 1992).). Researchers have developed mechanical devices for reducing the consequences of vehicular crashes (MTC, 2005); (Forthepeople, 2010); (PEDSAFE, 2004); (AASHTO, 2001); (ADA, 2006). Vehicular factors such as crash avoidance and crashworthiness; and en-vironmental factors which include roadway designs were useful eliminators of road crashes (Forthepeople, 2010); (Safety 2010); (ITE, 1999); (FHWA, 2006);
(AASHTO, 2001). Trial versions of safety systems for tractor, trailers and buses have also been reviewed to include communication by the blinking of red light on the dashboard (MTC, 2005); (USDT, 2000); (McMahon et al, 2005). Traffic crashes avoidance systems were available for use in vehicles (FHWA, 2006); (Nabti & Ridgeway, 2002); (Safety, 2010). The drivers' attention has been kept on the road by audio signals that remind them of such crashes (TDM, 2006); (NCHRP, 2004); (Pegrum, 1972). Generally, smart signs were found to be the most realistic new-age traffic safety devices because they are cheap (Zegeer, Stewart, Huang & Largerwey, 2002); (NCHRP, 2004); (TCDH, 2001). Some trucks contain GPS devices that will inform the driver of danger ahead as the truck enters a region notorious to accidents (Nelson & Allen, 1997); (Uyanga, 2000); (Safety, 2010); (pubhealth, 2010).
Many researchers have carried out some studies on how environmental conditions can cause accident on vehicles. For example, Turner, Sandt, Toole, Benz, & Patten (2004) used polychotomous response models to determine the effect of rainfall on single-vehicle crash severities. Conclusion drawn from this study was that the
backward sequential logistic regression model produced the best results for predicting crash severities in rainy weather where rainfall intensity, wind speed, roadway terrain, driver's gender, and safety belt were found to be statistically significant.
Other studies on an intellectualized evaluation model for highway safety countermeasure of grade intersection are remarkable in that it proposes the at-grade intersection safety countermeasure system. With CRF (crash reduction
factor) tools utilization, the effectiveness analysis of highway safety
counter-measures was implemented. Based on the results from CRF analysis, the
intelle-tualized evaluation model (IEM) for highway safety countermeasure was
esta-blished (Okpala, 1977); (Onakomaiya, 1985); (Oyefesobi, 1977). The study that measured the criticality of road accidents due to bad road and poor infrastructural facilities is available (Kareem, Oke & Lawal, 2011).
The aforementioned studies covered the areas of vehicular crash severity, safety, and criticality. There are no identified efforts that deal with the issue of accident fatality prediction. In this study a quantitative tool is provided for predicting the fatality of road accidents in Nigeria. Data from the accurate prediction of road accident fatalities would help the demographers, safety and health workers in planning for infrastructural faculties required to maintain good roads, sound safety and healthcares delivery, respectively. The rest of the paper is presented thus: materials and methods are presented in Section 2. Section 3 is the results and discussion, while conclusion is in Section 4. At the end of the paper are the lists of references and biographical notes.
2. MATERIALS AND METHODS
2.1. Data collection and analysis
Data on accident victims were collected through questionnaire administration and oral interviews of the road safety staffers. Some data were retrieved from the document obtained from the head quarters of the Federal Road Safety
commission (FRSC) in the various States of Nigeria. The data obtained were
analyzed statisti-cally based on averages, frequency counts and probability of occurrences. The ana-lysed data were interpreted using regression approach. The nature of the accident data per annum and the outcomes of the analyses of the effects of the accidents are shown in Table 1 based on Nigerian States. Time rate (in mins) per occurence of casualty or fatal case was obtained as the ratio of time (annum, 525600 mins) considered, to the respective total number of occurences.
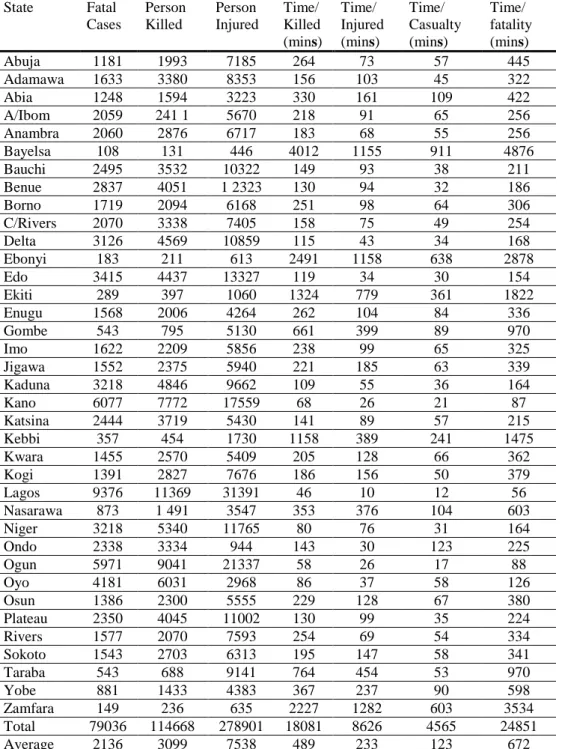
Table 1 Categories of accidents data per annum for the Nigerian States State Fatal Cases Person Killed Person Injured Time/ Killed (mins) Time/ Injured (mins) Time/ Casualty (mins) Time/ fatality (mins) Abuja 1181 1993 7185 264 73 57 445 Adamawa 1633 3380 8353 156 103 45 322 Abia 1248 1594 3223 330 161 109 422 A/Ibom 2059 241 1 5670 218 91 65 256 Anambra 2060 2876 6717 183 68 55 256 Bayelsa 108 131 446 4012 1155 911 4876 Bauchi 2495 3532 10322 149 93 38 211 Benue 2837 4051 1 2323 130 94 32 186 Borno 1719 2094 6168 251 98 64 306 C/Rivers 2070 3338 7405 158 75 49 254 Delta 3126 4569 10859 115 43 34 168 Ebonyi 183 211 613 2491 1158 638 2878 Edo 3415 4437 13327 119 34 30 154 Ekiti 289 397 1060 1324 779 361 1822 Enugu 1568 2006 4264 262 104 84 336 Gombe 543 795 5130 661 399 89 970 Imo 1622 2209 5856 238 99 65 325 Jigawa 1552 2375 5940 221 185 63 339 Kaduna 3218 4846 9662 109 55 36 164 Kano 6077 7772 17559 68 26 21 87 Katsina 2444 3719 5430 141 89 57 215 Kebbi 357 454 1730 1158 389 241 1475 Kwara 1455 2570 5409 205 128 66 362 Kogi 1391 2827 7676 186 156 50 379 Lagos 9376 11369 31391 46 10 12 56 Nasarawa 873 1 491 3547 353 376 104 603 Niger 3218 5340 11765 80 76 31 164 Ondo 2338 3334 944 143 30 123 225 Ogun 5971 9041 21337 58 26 17 88 Oyo 4181 6031 2968 86 37 58 126 Osun 1386 2300 5555 229 128 67 380 Plateau 2350 4045 11002 130 99 35 224 Rivers 1577 2070 7593 254 69 54 334 Sokoto 1543 2703 6313 195 147 58 341 Taraba 543 688 9141 764 454 53 970 Yobe 881 1433 4383 367 237 90 598 Zamfara 149 236 635 2227 1282 603 3534 Total 79036 114668 278901 18081 8626 4565 24851 Average 2136 3099 7538 489 233 123 672
Table 2 Annual accident victims and population of road users Year Person Killed Person Injured Population Total Casualty Casualty/ fatality 1960 1083 10216 20817891 11299 5 1961 1313 10614 31890354 11927 6 1962 1578 10341 33000138 11919 6 1963 1532 7771 34148543 9303 4 1964 1769 12581 35336912 14350 7 1965 1918 12024 36566656 13942 7 1966 2000 13000 37839156 15000 7 1967 2400 1000 39155958 12400 6 1968 2808 9474 40518586 12282 6 1969 2347 8804 41926337 11150 5 1970 2893 13154 43387749 16047 8 1971 3206 14592 44897643 17798 8 1972 3921 16161 46460081 20082 9 1973 4637 18154 48076891 22691 11 1974 4992 18660 49749967 23652 11 1975 5552 20132 51481266 25684 12 1976 6761 28155 53272881 34916 16 1977 8000 30023 55126708 38023 18 1978 9252 28854 57145118 38106 18 1979 8022 21203 59131288 29225 14 1980 8736 25401 61084542 34220 16 1981 10202 26337 63210285 36539 17 1982 11382 28539 65410002 39921 19 1983 10462 28686 67686271 32328 15 1984 8830 23861 70041755 32691 15 1985 9221 23851 72479206 33074 15 1986 8154 22176 75001482 30330 14 1987 7912 22747 77611534 30659 14 1988 9077 24413 80312415 33490 16 1989 8714 23687 83107248 32401 15 1990 7755 23490 85999420 31204 15 1991 7523 25627 88992000 33150 16 1992 8701 25154 92088111 33855 16 1993 6341 22882 95293251 29224 14 1994 5407 17890 98613440 23297 11 1995 6647 14431 102050991 21078 10 1996 6364 15290 105564166 21658 10 1997 6104 15464 109200353 21568 10 1998 6538 17341 112963496 23876 11 1999 5370 17585 116859503 22955 11 2000 6521 20671 120891747 27198 13
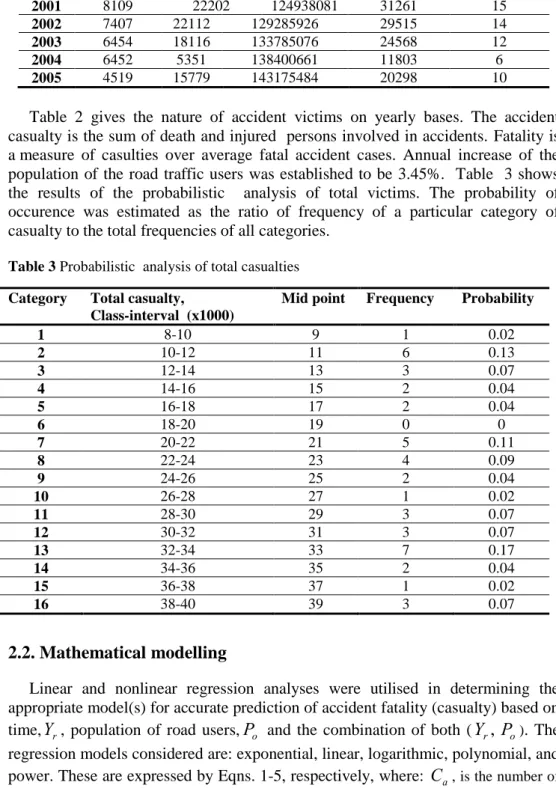
2001 8109 22202 124938081 31261 15
2002 7407 22112 129285926 29515 14
2003 6454 18116 133785076 24568 12
2004 6452 5351 138400661 11803 6
2005 4519 15779 143175484 20298 10
Table 2 gives the nature of accident victims on yearly bases. The accident casualty is the sum of death and injured persons involved in accidents. Fatality is a measure of casulties over average fatal accident cases. Annual increase of the population of the road traffic users was established to be 3.45%. Table 3 shows the results of the probabilistic analysis of total victims. The probability of occurence was estimated as the ratio of frequency of a particular category of casualty to the total frequencies of all categories.
Table 3 Probabilistic analysis of total casualties Category Total casualty,
Class-interval (x1000)
Mid point Frequency Probability
1 8-10 9 1 0.02 2 10-12 11 6 0.13 3 12-14 13 3 0.07 4 14-16 15 2 0.04 5 16-18 17 2 0.04 6 18-20 19 0 0 7 20-22 21 5 0.11 8 22-24 23 4 0.09 9 24-26 25 2 0.04 10 26-28 27 1 0.02 11 28-30 29 3 0.07 12 30-32 31 3 0.07 13 32-34 33 7 0.17 14 34-36 35 2 0.04 15 36-38 37 1 0.02 16 38-40 39 3 0.07
2.2. Mathematical modelling
Linear and nonlinear regression analyses were utilised in determining the appropriate model(s) for accurate prediction of accident fatality (casualty) based on time,
Y
r, population of road users,P
o and the combination of both (Y
r,
P
o). Theregression models considered are: exponential, linear, logarithmic, polynomial, and power. These are expressed by Eqns. 1-5, respectively, where:
C
a, is the number ofaccident casualties per annum;
P
o, is the annual population of road users;Y
r, is the year under consideration, anda,
b,...,
c,
are constant parameters of the models.o bP
a
aC
(1) c aPo bY Ca r (2)b
)
C
a
a ln(
P
o
(3) c bP aPon o ... Ca n-1 (4) b a C aPo (5)The appropriate predictive model was searched via the Correlation Coefficient,
R,
or Coefficient of Determination,R
2and the one whose value nearest to (1) was chosen as accurate. The same process was carried out for predicting the size of casualty at a given time,Y
r, and combination (Y
r,
P
o) variants. FatalityC
a/fwas also modelled in similar manner.3. RESULTS AND DISCUSSION
3.1. Analyses of the accident data
The results of time rates of accident fatality (casualty) for each of the States in Nigeria are presented in Table 1. The fatality of road accidents is highest in Lagos State, where at least one fatal case of accidents was reported every 56 mins, with his corresponding casualty reports for all cases of accidents at every 12 mins. Bayelsa State recorded the least cases of accident fatality of 4876 mins interval. An average fatality time rate of 672 mins was estimated for the whole country. The results of accident fatality based on average annually accident victims with established annual population increase of 3.45 % (starting from 1960) are presented in Table 2. From this table it can be seen that accident fatality is changing erratically with increase in population. The highest fatality of 19 casualties was recorded in 1982, while the least of 4 casualties occured in 1963. The fatality results based on probability showed that highest casualty frequency counts of seven cases of road accidents were obtained annually with probability of 0.17 (Table 3).
3.2. Modelling analyses
The optimal models obtained for accident casualty and fatality prediction over time and population of road users, using Microsoft ExcelR, are presented in Figures 1-4. These models were chosen as optimal because they have highest coefficient of determination,
R
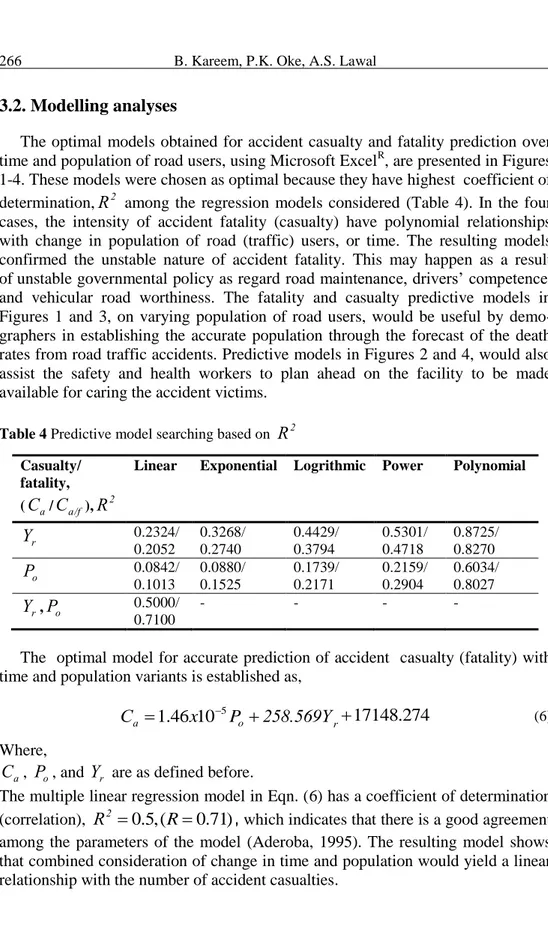
2 among the regression models considered (Table 4). In the four cases, the intensity of accident fatality (casualty) have polynomial relationships with change in population of road (traffic) users, or time. The resulting models confirmed the unstable nature of accident fatality. This may happen as a result of unstable governmental policy as regard road maintenance, drivers’ competence, and vehicular road worthiness. The fatality and casualty predictive models in Figures 1 and 3, on varying population of road users, would be useful by demo-graphers in establishing the accurate population through the forecast of the death rates from road traffic accidents. Predictive models in Figures 2 and 4, would also assist the safety and health workers to plan ahead on the facility to be made available for caring the accident victims.Table 4 Predictive model searching based on
R
2Casualty/ fatality, (
C
a/Ca/f),R
2Linear Exponential Logrithmic Power Polynomial
r
Y
0.2324/ 0.2052 0.3268/ 0.2740 0.4429/ 0.3794 0.5301/ 0.4718 0.8725/ 0.8270 oP
0.0842/ 0.1013 0.0880/ 0.1525 0.1739/ 0.2171 0.2159/ 0.2904 0.6034/ 0.8027 rY
,P
o 0.5000/ 0.7100 - - - -The optimal model for accurate prediction of accident casualty (fatality) with time and population variants is established as,
274 . 17148 10 46 . 1 5 258.569Y Ca x Po r (6) Where, a
C
,P
o, andY
r are as defined before.The multiple linear regression model in Eqn. (6) has a coefficient of determination (correlation),
R
2
0
.
5
,
(
R
0
.
71
)
, which indicates that there is a good agreement among the parameters of the model (Aderoba, 1995). The resulting model shows that combined consideration of change in time and population would yield a linear relationship with the number of accident casualties.Fig. 1 Optimal model for casualty prediction over population of road users
Fig. 2 Optimal model for casualty prediction over years
Fig. 4 Optimal model for fatality prediction over years
4. CONCLUSION
The outcomes of the study showed that vehicular accidents on Nigerian roads are highly fatal. It was also shown that the fatality of the accidents varies with road users’ population and time of maintaining adequate road infrastructural facilities, driving competency, vehicle structural condition, drivers’ attitude, appropriateness of road safety signs, among others. The high probability of road accident fatality in Nigeria was borne out of the fact that many of the existing roads are in deplorable conditions. Installation of good maintenance culture on the highways will reduce the pang of road accidents.
The results have shown clearly that thousands of people lost their life to the road accidents annually, and the lost will be risen in future if care is not taken. The high fatality of road accident has revealed the laxity on the part of the policy makers in the areas of provision of: essential infrastructural facilities; and effective road maintenance programme. Data from the accurate prediction of road accident fatalities would help the demographers, safety and health workers in planning for infrastructural faculties required for maintaining good roads, sound safety and healthcare delivery. It is recommended that attention should be paid to road accident prevention to avoid unplanned expenses through suplementary budgeting for the unexpected rise in accident casualties.
ACKNOWLEDGEMENTS
Authors wish to acknowledge the support given by the management of the Federal University of Technology, Akure, Nigeria in providing facilities used for this study
REFERENCES
AASHTO (2001), “Policy on Geometric Design of Highways and Streets”, 2001 4th Edition. Chapter 3, Elements of Design. American Association of State Highway and Transportation Officials (AASHTO).
ADA (2006), “Americans with Disabilities Act (ADA) and the Architectural Barriers Act (ABA) Accessibility Guidelines for Buildings and Facilities”. Chapter 4: Accessible Routes, Section 403: Walking Surfaces. U.S. Access Board July 23, 2004 Available: www.access-board.gov/ada-aba/final.htm#Surfaces. (accessed February 16, 2006). Adeniyi A., (1985), “Provision of Mass Transit in Nigerian Cities”, - Transportation in
Nigerian for national development, Federal Road Safety Corps, Nigeria.
FHWA (2006), “The Manual on Uniform Traffic Control Devices (MUTCD) 2003”, Federal Highway Administration (FHWA), Part 7, “Traffic Controls for School Areas Section”, Chapter 7A. General, Section 7A.04 Scope. Available: http://mutcd.fhwa.dot.gov/pdfs/2003r1/Ch7.pdf. (accessed February 13, 2006). Flaherty C.A., (1974), “Highways and Traffic. Highways”, Vol. 1, Edward Arnold,
(Publishers) Ltd, London.
Forthepeople (2010), “Information from www.forthepeople.com/automobile-accident-prevention--11-1851.html “- United States, retrieved November 2010
Hawkey L., Henson C., Hulse A., Brindle R., (1992), “Towards Traffic Calming: a Practitioners Manual”, Federal Office of Road Safety, Canberra, Australia, August 1992.
ITE (1999), “ Traffic Calming State of the Art”, Institute of Transportation Engineers and the Federal Highway Administration.
JRA (1969), “Japan Road Association- Accident Prevention Effects of Road Safety Devices”, Annual Report.
Kareem B., Oke P.K., Lawal A.S. (2011),”Determination of criticality of road accidents in Nigeria”, K. Grzybowska, P. Golinska (Eds.), Selected logistics problems and solutions, Poznan University of Technology, Poznan.
McMahon P., Zegeer C., Duncan C., Knoblauch R., Stewart J., Khattak A., (2005), “An Analysis of Factors Contributing to Walking Along Roadway Crashes”, Research Study and Guidelines for Sidewalks and Walkways Report No. FHWA-RD-01-101. University of North Carolina Highway Safety Research Center, Chapel Hill, NC. February 2002. Available: www.walkinginfo.org/pdf/r&d/Sidewalk-Report.pdf (accessed December 16, 2005).
MTC (2005), “Metropolitan Transportation Commission website. Planning; Bicycle/Pedestrians Safety Toolbox, Engineering, Roadway lighting
improvements”, Available:
www.mtc.ca.gov/planning/bicyclespedestrians/tools/roadwayLighting/index.htm. (accessed December 19, 2005).
Nabti J., Ridgeway M., (2002), “Innovative Bicycle Treatments: An Informational Report”, Institute of Transportation Engineers. Washington, D.C. May 2002.
NCHRP (2004), National Cooperative Highway Research Program”, Report 500, Vol 10: A Guide for Reducing Collisions Involving Pedestrians. Transportation Research Board. Washington, D.C. 2004. Available: http://trb.org/news/blurb_detail.asp?id. (accessed December 16, 2005).
Nelson A., Allen D., (1997), “If You Build Them, Commuters Will Use Them”, Transportation Research Record, 1997. 1578: p. 79-83.
Okpala D.C.I., (1977), "Urban Traffic Management in Nigerian cities - The Necessity for Mass Transit Priorities", in Onakomaya, S.O. Transportation in Nigerian National Development. NISER, Ibadan
Onakomaiya S.O. (1985), “Transport Co-ordination Systems in Nigeria", Transportation in Nigeria National Development, NISERJbadan.
Oyefesobi O., (1977), "Measures to improve Traffic flow and reduce Road accidents in Nigeria" in Onakomaya, S.O., Transportation in Nigeria National Development, NLSER, Ibadan. PEDSAFE (2004), “Pedestrian Safety Guide and Countermeasure Selection System
September”, 2004, FHWA-SA-04-003 U.S. Department of Transportation Federal Highway Administration Available www.walkinginfo.org/pedsafe/index.cfm Pegrum B., (1972), The Application of Certain Traffic Management Techniques and Their
Effect on Road Safety”, National Road Safety Symposium.
Pubhealth (2010), “Information from www.ncbi.nlm.nih.gov/pmc/articles, (accessed November 2010)
Safety (2010), “Information from http://www.valvoline.com/car-care/automotive-topics/safety/dsm20030801ap”, retrieved November 2010
TCDH (2001), “Traffic Control Devices Handbook 2001”, Pline J, Editor. Institute of Transportation Engineers, Washington D.C. 2001.
TDM (2006), “Victoria Transport Policy Institute TDM Encyclopedia; Roadway Connectivity, Creating More Connected Roadway and Pathway Networks”, Available: www.vtpi.org/tdm/tdm116.htm. Accessed: March 3, 2006.
Turner S., Sandt L., Toole J., Benz R., Patten R., (2004), “FHWA University Course on Bicycle and Pedestrian Transportation”, Draft Report, Federal Highway Administration, McLean, VA, May 2004.
USDT (2000), “Manual on Uniform Traffic Control Devices, Millennium Edition. U.S. Department of Transportation”, Federal Highway Administration, December 2000. Uyanga J.T., (2000), “Information for Transport Policy in Nigeria" in Onakomaya, S.O.,
Transportation in Nigerian National Development, NISER Ibadan.
Zegeer C., Stewart J., Huang H., Lagerwey P., (2002), “Safety Effects of Marked vs. Unmarked Crosswalks at Uncontrolled Locations: Executive Summary and Recommended Guidelines”, FHWA-RD-01-075 Federal Highway Administration, U.S. Department of Transportation, McLean, VA, 2002. Avaiable: http://www.walkinginfo.org/pdf/r&d/crosswalk_021302.pdf (accessed December 13, 2005).
BIOGRAPHICAL NOTES
Buliaminu Kareem is a Senior Lecturer at the Federal University of Technology, Akure, Nigeria. He teaches engineering management courses such as Operations Research, Work Study, Production and Maintenance Management. His research interests are Industrial/Production Systems Design, Optimisation and Maintenance. He is a reviewer to many reputable journals including European Journal of Operational Reseach and Internation Journal of Management Science. His papers appear in numerous journals including Journal of Computing, Internet and
Management, Thailand, and Journal of Applied Mathematics and Bioinformatics, Greece.
Peter Kayode Oke is a Senior Lecturer at the Federal University of Technology, Akure, Nigeria. He teaches production and operations management courses such as Machine Tools Management, Network Analysis, and Operations designs. His research interest is Industrial Systems Management. His papers appear in numerous journals including Journal of Applied Mathematics and Bioinformatics, Greece, and Nigerian Journal of Engineering Management.
Ayodele Salami Lawal is a Teaching Assistant at the Federal University of Technology, Akure, Nigeria. He holds B.Eng (Mechanical Engineering), and M.Eng (Production Engineering). He specialises in the area of Production System design and Maintenance management. His paper appears in journals including Journal of Applied Mathematics and Bioinformatics, Greece.