PAVOL HORIČKA, JAROMÍR ŠIMONEK
Identification of agility predictors in basketball
TRENDS
in
Sport Sciences
2019; 1(26): 27-32 ISSN 2299-9590 DOI: 10.23829/TSS.2019.26.1-4 IntroductionI
n basketball as in other sport games, agility represents one of the most important motor manifestations of the player. Agility is considered to be not only motor but also physiological prerequisite of the player in basketball, since players frequently perform sudden unpredictable changes of direction of movement and speed of movement during the match [18] based on the sufficient level of metabolic, anatomic and physiologic factors. Change of direction of movement and agility are specific athletic movements requiring the combination of physical, technical and tactical attributes. In the course of the game, top basketball players cover the distance of 991 m using highly intensive movements, perform 40-60 maximal jumps and 50-60 changes of speed and direction of movement [8, 14], while stressing the importance of these physical attributes.Several authors consider strength, agility and speed to be the primary qualities of elite basketball players [18]. However, we may not forget physiological components of agility. Although basketball players need high level of aerobic capacity in order to recover from short-time intensive actions, majority of authors agree that basketball rely first of all on anaerobic metabolism [1, 15]. Consequently, anaerobic loading represents
Abstract
Aim of Study. This study aims at finding out the existence and
character of determining factors of agility performance. Material and Methods. Individual types of agility performance (Illinois test, Fitro agility check, modified Y-test), reaction and acceleration speed (10 m dash) and cyclic running speed (30 m run), spatial orientation (shuttle run) were diagnosed in the selected sample of basketball players in order to identify agility predictors. The sample consisted of 12 players of top female basketball team BKM UKF Nitra, Slovakia (n = 12). Agility score was calculated using the device Fitro agility check (FAC), time was measured using the Witty time measurement instrument and lighting device WittySem traffic light. The level of cognitive abilities was detected by means of the Stroop test. Spearman correlation was used for the assessment of the relationship among all three levels of agility performance (Illinois test, Y agility test, Fitro agility test) and other indicators. Results. In case of simple agility performance, the correlation analysis showed (change of direction speed; CODS, Illiois test) significant correlation with reactive agility, acceleration speed and also simple reactive agility. In case of complex reactive agility, significant correlation was found with pre-planned (running) agility (Illinois); simple reactive agility (Y-test) and cognitive abilities (Stroop test). The factor of acceleration speed (ACC – 3 m) showed greatest share (71.5%) in the reactive agility performance of basketball players of the selected sample. Conclusions. Our findings suggest that
COD and RA are two different and independent skills. The share of motor predictors of agility performance decreases with the complexity of agility, while the share of mental cognitive factors on the cultivation of agility increases.
KEYWORDS: basketball, cognitive abilities, pre-planned agility, reactive agility.
Received: 12 January 2019 Accepted: 16 February 2019
Corresponding author: phoricka@ukf.sk
Constantine the Philosopher University in Nitra, Faculty of Education, Department of Physical Education and Sport, Nitra, Slovakia
more important type of loading than the aerobic one upon realizing adaptation stimuli in elite basketball [13]. Traditional definitions of agility say that agility includes the speed of changing the direction of movement of an athlete [23] or „fast movements of the whole body with the change of direction or speed of movement in reaction to some stimulus” [9]. When determining the level of agility this definition includes also cognitive abilities and relates only to open-loop skills. Neurobiology defines cognitive functions as the ability to participate in, identify and plan responses to external stimuli and internal motivations [2]. Performing effective changes of movement direction with the ball, as well as without it, frequently locates main qualitative differences between the performance of basketball players [8], therefore, this ability requires a combination of perceptive cognitive factors and strength characteristics [4] and often represents the decisive element in performance differences among the players in a match. Even that it is accepted that planned movements are important for a sport performance in a game, the limitation of the commonly used speed tests of agility (e.g. Illinois test) is that they are no table to evaluate the perceptive component of agility.
The reason for a deeper investigation of agility performance is the necessity of the players’ reaction to permanently changing situation in the match – changes of position and course of the flight of the ball, teammates, opponents, or certain tactical variability of the game. Closed-loop skills, typical for common training stimuli, such as shuttle run or pre-planned course of running and change of direction and speed of movement to various bases, can be planned in advance and learned, while being performed automatically, without the necessary reacting to external stimuli [21]. On the other hand, open skills may not be pre-planned and are typical for the performance of the player. In this connection, we can speak about the term “reactive agility”. It is a part of agility performance including the movement of the player in reaction to the changing stimulus.
Currently, reactive agility has not been explained in details despite the fact that it forms a prerequisite for many sports, where the change of speed and direction of movement in response is primary [7]. In general, it holds that agility, defined also as “multiplanary or multidirectional skill” [6], includes several components which in principle, are divided into those which are connected with decision-making processes and those ones which are determined by the speed of change of direction of movement, acceleration and deceleration [12].
Material and Methods
The aim of the study was to determine the relationship between the level of individual types of agility (Illinois test, Fitro agility check, Y-test), reaction, speed of acceleration (modified test – 10 m dash) and cyclic running speed (30 m run), spatial orientation (shuttle run) with the aim to identify the most valid predictors of agility. For this purpose, 12 female players of the top basketball team of BKM UKF Nitra, Slovakia were chosen as the research sample. The average decimal age was 21.67 years, the average body heigh was 177.22 cm and average body weigh was 64.52 kg. All participants voluntarily confirmed their willingness to participate in a particular research. Contributors have informed consent from all survey participants.
Agility score was calculated using the device Fitro agility check (FAC), time was measured using the Witty time measurement instrument and lighting device WittySem traffic light. The level of cognitive abilities was detected by means of the Stroop test. Spearman correlation was used for the assessment of the relationship among all three levels of agility performance (Illinois test, Y agility test, Fitro agility test) and other indicators.
In order to clarify the share of individual factors in the structure of agility performance, testing of the following indicators were carried out:
− Factor 1 – reaction and acceleration speed: 10 m dash; − Factor 2 – explosive power of lower extremities:
triple jump;
− Factor 3 – spatial orientation: shuttle run; − Factor 4 – pre-planned agility: Illinois test [10]; − Factor 5 – reactive agility/simple choice reaction
speed: Y-test [16];
− Factor 6 – reactive agility/complex reactive agility: Fitro agility check [11];
− Factor 7 – cognitive abilities: Stroop test [5].
For the purpose of a deeper analysis of the factors Y-test was modified through registering the times before the selective reaction stimulus (3 m) also in the finish (6 m). When finding out the relationship between individual attributes Spearman coefficient of rank correlation (from –1 to 1) was used [17]. The significance level (α = 0.05) was used to refer to a pre-chosen probability. P value we used to indicate a probability. We considered such a significant dependence if the p-value is less han 0.05.
For the analysis of the impact of the values of one or several independent variables on the values of the dependent variable regression analysis was epmloyed. The above mentioned method served for observing the degree of impact of independent variables of all
motor abilities tested on the performance in reactive agility test (FAC). Using the methods of multiple correlation, stepwise and regression analysis, the share (%) of independent variables on the explanation of the performance in FAC was calculated. For the selection of the variable regressors, stepwise procedure was used. Statistic processing was performed using SPSS software.
Results
Based on the values of test results we determined the basic characteristics of the measure of position – Descriptive Statistics – women (Table 1).
Based on the assessment of the relationships in the observed indicators the following facts have been observed (Table 2).
When looking for the limiting factors of pre-planned agility (CODS) we observe relevant relationships with
Table 1. Descriptive Statistics – women
Test Mean Std. Dev. Min. Max.
Percentiles 25th 50th (Median) 75th Run 10 m (s) 2.14 0.09 2.01 2.26 2.07 2.12 2.23 Triple jump (m) 8.48 0.06 8.31 8.68 8.52 8.57 8.64 Shuttle run (s) 8.57 0.49 7.88 9.36 8.02 8.71 9.00 Illinois (s) 16.3 0.80 15.71 17.98 16.17 17.10 17.70 Y-test (s) 2.68 0.23 2.32 2.94 2.48 2.74 2.89 FAC (ms) 1488.51 82.15 1364.80 1640.30 1430.00 1484.55 1531.50
Stroop test (IF) 6.05 10.20 –14.27 38.52 5.97 10.01 8.51
Note: s – second, m – meter, IF – score, Std. Dev. – Standard Deviation
Table 2. Correlations FAC Illinois 10 m run ACC (3 m) Y-test (6 m) Shuttle run Triple jump Stroop test Spearman’ s rho FAC Correl. Coeff. 1.000 Sig. (2-tailed) . Illinois Correl. Coeff. 0.664 1.000 Sig. (2-tailed) 0.018 . 10 m run Correl. Coeff. 0.515 0.883 1.000 Sig. (2-tailed) 0.087 0.000 . ACC (3 m) Correl. Coeff. 0.424 0.778 0.712 1.000 Sig. (2-tailed) 0.170 0.003 0.009 . Y-test (6 m) Correl. Coeff. 0.783 0.923 0.764 0.841 1.000 Sig. (2-tailed) 0.003 0.000 0.004 0.001 . Shuttle run Correl. Coeff. 0.340 0.480 0.584 0.582 0.459 1.000 Sig. (2-tailed) 0.280 0.114 0.046 0.047 0.134 . Triple jump Correl. Coeff. –0.193 –0.365 –0.550 –0.192 –0.214 –0.552 1.000 Sig. (2-tailed) 0.548 0.243 0.064 0.551 0.504 0.063 . Stroop Correl. Coeff. 0.834 0.459 0.317 0.367 0.396 0.251 0.251 1.000 Sig. (2-tailed) 0.021 0.134 0.406 0.332 0.357 0.516 0.516 .
other indicators in 4 cases: as expected, relatively high measure of dependence on running speed (10 m dash) with the value of R = 0.883; p = 0.000 < 0.01, on acceleration speed (3 m; R = 0.778, p = 0.003), while the highest degree of dependence was observed between reactive agility (Y-test 6 m) and pre-planned agility (Illinois) (Y-test; R = 0.923, p = 0.000). Significance of this relationship was proved on both levels of significance (1%, 5%). The fourth highly significant indicator in the female team was the relationship in the level of reactive agility (FAC), where R = 0.664; p = 0.003 < 0.01; 1% high level of significance.
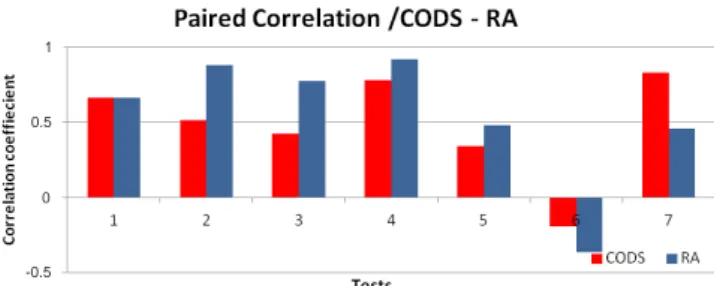
When assessing the relationships between the observed indicators in female category, in case of reactive agility (RA), significant relationship was proved in three cases: in relationship with simple running agility (CODS, Illinois test), where R = 0.664; p = 0.018 < 0.05, which represents 5% level of significance, in relationship with simple reactive agility (R = 0.783; p = 0.023 < 0.05), and also with the level of cognitive abilities (R = 0.784, p = 0.021 < 0.05).
The relationship between both types of reactive agility connected with the selective reaction to two stimuli (Y-test) and complex selective agility connected with the reaction to four stimuli (FAC) was also assessed. The relationship was statistically significant with the values of R = 0.783; p = 0.003 < 0.01. The same significance was found also between pre-planned and reactive agility (Figure 1, Table 2). We can assume that the observed types of agility have identical determinants.
Surprisingly, no causal relationship was found between agility and explosive power of legs. We can hypothesize that this was caused by the character of the test (explosiveness during triple jump), higher necessity of absolute power, or other unexpected facts.
Regression analysis in the tested sample did not show any changes, therefore we selected two variables. In regression analysis without stepwise analysis no variable was statistically significant. Relationship between the tested factor (FAC) and other factors (remaining tests) was modelled using multiple linear regression, while stepwise procedure was used for the selection of variable regressors (Table 3).
In our case of prediction equation for both models the value Y is represented by the test (FAC). Other tests represent the values of x1, x2 – ...x8. If sig. = ˂ 0.05, then the relevant variables significantly influence the values of Y, in the test Fitro agility check (FAC). We can state that the tested performance in acceleration speed (ACC – 3 m) participated most in both cases on the performance of reactive agility (FAC). In the observed sample it represented 71.5%. Another independent variable, which participated in the complex reaction agility test (Y-test) with the percentage share of 53.2%, was recorded. Cognitive abilities had 46% share in the performance in FAC. No significant relationship was
Table 3. Regression
Model Unstandardized coefficients Standardized coefficients
Correlations
B Std. Error Beta t Sig. Zero-order Partial Part
(Constant) 7337.040 3714.377 1.975 0.119 10 m run –104.004 481.406 –0.110 –0.216 0.840 0.463 –0.107 –0.034 Triple jump –661.533 381.973 –0.487 –1.732 0.158 –0.332 –0.655 –0.275 Shuttle run 8.331 38.323 0.050 0.217 0.839 0.456 0.108 0.034 Illinois –72.672 45.625 –0.712 –1.593 0.186 0.519 –0.623 –0.253 Y-test 6 m 656.500 141.790 1.805 4.630 0.010 0.730 0.918 0.734 FAC –712.408 268.063 –0.733 –2.658 0.057 0.286 –0.799 –0.421 Stroop –820.050 312.540 0.914 3.710 0.661 0.249 0.814 0.376
Figure 1. Paired Correlation / CODS – RA
Note: CODS – change of direction speed; RA – reactive agility; Test 1 – 10 m run; Test 2 – triple jump; Test 3 – shuttle run; Test 4 – Illinois test; Test 5 – Y-test; Test 6 – Fitro agility check; Test 7 – Stroop test
0.5 1
-0.5 0
surprisingly found between the performance in FAC and explosive strength of legs. In line with the published research articles [3, 10, 12] this fact can be explained by the more significant influence of absolute strength than the explosive one. Changes of direction of movement obviously require a more dominant power component.
Discussion
We can state that agility performance is conditioned by a wide range of physical and also mental factors. Several authors dealt with their structure. During game situations, unexpected direction changes occur more frequently than the planned changes. This fact should be manifested not only in the structure of agility performance but also in the way of diagnosing agility, and of course in planning and realization of training means.
Many articles deal with the impact of various kinds of strength abilities on agility performance. It has been proved that agility performance of the player is determined by the speed in the changing direction of movement and is also impacted by explosive power, balance, muscular coordination and flexibility [15], or it has physiological characteristics also in soccer [1, 13]. The ability to change direction of movement includes also the combination of several types of strength [6]. Some articles observe different degree of correlations between lower extremities strength (measured by maximal strength in a squat) and agility performance [3, 10, 12]. However, the relationship between strength and agility is not fully linear but high level of lower extremities’ strength seems to be the cause of improvement in agility performance. Performing two unexpected directional changes increased the demands on leg muscles required during the movements in agility performance [11, 16]. Correlations between the tests of reactive agility and the speed of directional change suggest that they represent relatively independent skills [12]. It was founded differences between the speed and agility performance of professional and amateur soccer players [7].
Other authors [22] in their research proved significant correlation of agility with maximal dynamic, isometric, concentric and eccentric strength, while eccentric power was identified as a single predictor of agility performance. These findings demonstrate importance of components with different types of strength for agility performance, while stressing excentric power as the determining factor.
There are also articles investigating the relationship between speed in simple (COD) and reactive agility (RA) [4, 12]. Significant differences (p ≤ 0.05) were observed both in men and women in all tests as well as
between the performances in COD and RA. Significant correlations were found between running speed (30 m) and performance in COD and lateral flexibility.
In another study [20] the impact of physical and cognitive parameters on agility performance was studied. Pearson’s correlation analysis was used for the determination of relationships between various predictive variables (age, weight, body composition, 5-m, 10-m and 20-m dash, speed, duration of skill, response time and time of decision-making) and reactive agility (RA). Measurement of morphological structure, short-distance acceleration and speed of change of direction showed low to medium correlation with the time of reactive agility. On the contrary, response time and decision time showed large to very large relationships with reactive agility time.
Analysis of components in 32 tests of agility proved 7 statistically significant tests in relationship with agility with logical objective relationship [19]. This finding is in favour of agility as the complex motor ability.
Conclusions
Reactive agility in the form of the change of direction speed is a motor reaction to an unexpected external stimulus. The aim of coaches should be to improve reactive agility performance by means of implementing not only pre-planned exercises but also training means including reactions to unexpected stimuli. These specific exercises, along with optionally arranged adaptation stimuli, should establish a high transfer to a particular movement task that is performed under competitive cinditions (specific exercises).
From among motor abilities, the performance in reactive agility is limited mainly by the ability to accelerate speed. From among mental abilities, cognitive ones play the most important role. Current findings suggest that COD and RA are 2 independent and different skills, which define agility.
We also take into consideration that the selection of children for basketball based on anthropomotoric and physical profile need not be sufficient, since it does not include cognitive abilities.
We can state that the share of motor predictors of agility decreases with the complexity of agility, while the share of mental cognitive abilities increases. With respect on presented results we think that velocity and cognitive abilities are primary predictors of agility.
Acknowledgements
This paper was made possible with the generous support of the scientific grant VEGA no. 1/0454/16 titled
“Complex Physical Ability of Agility and Possibilities of its Development in Selected Sports“.
References
1. Brooks GA, Fahey TD, White TP. Exercise Physiology. Human Bioenergetics and Its Applications. 2nd ed. Mountain View, California: Mayfield; 1996.
2. Cole MA, Ward J. Student’s Guide to Cognitive Neuroscience. 2nd ed. 2010; 16(5): 945-946. DOI: 10.1017/ S1355617710000937.
3. Cronin JB, Hansen KT. Strength and power predictors of sports speed. J Strength Cond Res. 2005; 19(2): 349-357. 4. Čoh M, Vodičar J, Žvan M, Šimenko J, Stodolka J, Rauter S,
et al. Are change-of-direction speed and reactive agility independent skills even when using the same movement pattern? J Strength Con Res. 2018; 32(7): 1929-1936. DOI: 10.1519/JSC.0000000000002553.
5. Daniel J. Stroopov test – príručka (Stroopov test – manual). Psychodiagnostické a didaktické testy: Bratislava; 1983. 6. Dellal A, Wong DP, Moalla W, Chamari K. Physical and
technical activity of soccer players in the Frenche first division with special reference to the playing position. Int J Sports Med. 2010; 11(2): 278-290.
7. Dolan K. Reactive agility, core strength, balance, and soccer performance. Master’s thesis. New York: Ithaca College; 2013.
8. Farrow D, Young W, Bruce L. The development of a test of reactive agility for netball: a new methodology. J Sci Med Sport. 2005; 8(1): 52-60. DOI: 10.1016/S1440-2440(05)80024-6.
9. Gamble P. Strength and conditioning for team sports: sport-specific physical preparation for high performance. 2nd ed. London: Routledge; 2013.
10. Getchell B. Physical fitness: a way of life. 2nd ed. New York: John Wiley and Sons; 1979.
11. Hamar D, Zemková E. Posudzovanie disjunktívnych reakčno-rýchlostných schopností (Assessing disjunctive reaction abilities). 1st ed. Bratislava: FTVŠ UK; 2001. 12. Horička P, Hianik J, Šimonek J. The relationship between
speed factors and agility in sport games. J Hum Sport Exerc. 2014; 9(1): 49-58. DOI: 10.4100/jhse.2014.91.06. 13. Hoffman JR, Epstein S, Einbinder M, Weinstein Y. The
influence of aerobic capacity on anaerobic performance
and recovery indices in basketball players. J Strength Cond Res. 1999; 13(4): 407-411.
14. Hoffman J, Fry AC, Howard R, Maresh CM, Kraemer WJ. Strength, speed and endurance changes during the course of a Division I basketball season. J Strength Cond Res. 1991; 5(3): 144-149.
15. LaMonte MJ, McKinney JT, Quinn SM, Bainbridge CN, Eisenman PA. Comparison of physical and physiological variables for female college basketball players. J Strength Cond Res. 1999; 13(3): 264-270.
16. Lockie RG, Schultz AB, McGann TS, Jalilvand F, Callaghan SJ, Jeffriess MD. Peak ankle muscle activity of faster and slower basketball players during the change-of-direction step in a reactive cutting task. J Ath Enhanc, 2015; 4(6): 1-6. DOI: 10.4172/2324-9080.1000216. 17. Markechová D, Stehlíková B, Tirpáková A. Štatistické
metódy a ich aplikácie (Statistical methods and their applications). Nitra: Univerzita Konštantína Filozofa v Nitre; 2011.
18. McInnes SE, Carlson JS, Jones CJ, McKenna MJ. The physiological load imposed upon basketball players during competition. J Sports Sci. 1995; 13(5): 387-397. DOI: 10.1080/02640419508732254.
19. Metikoš D, Markovic G, Prot F, Jukic I. Latent structure of agility obtained by a battery tests. Kinesiology. 2003; 35(2): 14-29.
20. Scanlan A, Humphries B, Tucker PS. Dalbo V. The influence of physical and cognitive factors on reactive agility performance in men basketball players. J Sports Sci. 2013; 32(4): 367-374. DOI: 10.1080/02640414.2013.825730. 21. Shepard JM, Young WB. Agility literature review:
classifications, training and testing. J Sports Sci. 2006; 24(9): 919-932. DOI: 10.1080/02640410500457109. 22. Spiteri T, Newton RU, Binetti M, Hart NH, Sheppard JM,
Nimphius S. Mechanical determinants of faster change of direction and agility performance in female basketball athletes. J Strength Cond Res. 2015; 29(8): 2205-2214. DOI: 10.1519/JSC.0000000000000876.
23. Young WB, James R, Montgomery I. Is muscle power related to running speed with changes of direction? J Sports Med Phys Fit. 2002; 42(3): 282-288.