1
Laboratory 5
Chromatography of plant extracts
Instruction
for the Laboratory
1
I. THEORETICAL INTRODUCTION 1. Chromatography
Chromatography is an analytical or preparative technique used to separate, identify and determine the composition of the test substance or mixture of chemicals. The basics of the chromatography techniques were developed in the early twentieth century in Warsaw as a result of researches provided by the Russian chemist and biologist Michael Cwiet. He was involved in research on plant pigments. Cwiet obtained the separation of several pigments in the form of horizontal bands in different colors, during passing up the solution of green pigments through a column (glass tube) filled with calcium carbonate. Cwiet has interpreted the separation process correctly and is therefore regarded as the inventor of this technique. The term chromatography was formed from greek word “Chromotos” – what means color and “grapho” - writes.
Chromatographic system consists of three basic elements:
• the stationary phase - stationary layer of the substance with developed surface area; porous substance; adsorbent (silica gel, alumina, cellulose),
• the mobile phase called eluent - which is liquid or a gas flowing through the stationary phase, • separated substances.
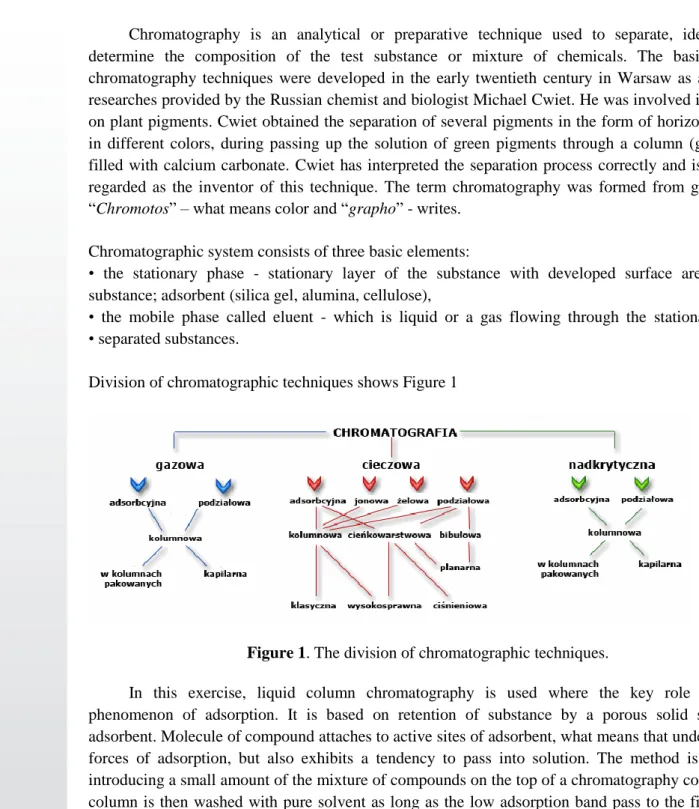
Division of chromatographic techniques shows Figure 1
Figure 1. The division of chromatographic techniques.
In this exercise, liquid column chromatography is used where the key role plays the phenomenon of adsorption. It is based on retention of substance by a porous solid surface of adsorbent. Molecule of compound attaches to active sites of adsorbent, what means that undergo to the forces of adsorption, but also exhibits a tendency to pass into solution. The method is based on introducing a small amount of the mixture of compounds on the top of a chromatography column. The column is then washed with pure solvent as long as the low adsorption band pass to the filtrate, and then the bands located above will be sequentially eluted. In this way, by changing the container below the column, different fractions of the mixture can be collected. After collecting all of the fractions, the detection of the individual components is carried out.
1
2. UV-Vis spectrophotometry
Electromagnetic radiation passing through the medium can be absorbed, reflected or scattered. The phenomenon of absorption of electromagnetic radiation by a solution of the test substance is used in the spectrophotometric methods.
To characterize the intensity of the radiation absorbed by the material medium (liquid), we use two fundamental properties: transmittance (T) and the absorbance (A). Transmittance is the ratio of the intensity of monochromatic radiation after passing through the sample (I) to its initial intensity (Io):
Transmittance shows what part of the incident radiation passed through the sample. Often transmittance is given as a percentage:
The absorbance of radiation is determined by the formula:
The absorbance indicates what part of radiation is absorbed by the sample. The wavelength at which the absorbance of the solution is measured, corresponds to the maximum absorbance (Amax) designated for the substance from the absorption spectrum. Absorption spectrum for
different types of particles is determined in a function of wavelength (λ). Absorption band usually has a shape similar to a bell-shaped curve described by the Gaussian function.
3. Plant extracts
Plant pigments are colored compounds which play a key role in the process of photosynthesis and give a suitable color of leaves. All photosynthetic organisms have their own pigments responsible for the absorption of light. They vary in structure, properties, functions and in visible light ranges that they can absorb.
A common feature of all assimilation pigments, allowing for the absorption of radiation is the presence of multiple bonds in the structure. The color depends on the group of atoms associated with those bonds.
The composition and content of pigments is dependent on the plant species and varies with the growth of the plant within the species, on the intensity and spectrum of light and the availability of minerals.
1
There are three groups of pigments: chlorophylls, carotenoids and phycobilins. In higher plants, there are two types of chlorophylls slightly different in construction: cyan chlorophyll a and yellow-green chlorophyll b. The amount of chlorophyll b is 2-3 times lower than the chlorophyll a. Other chlorophylls such a chlorophyll c and d are present only in some of the algae. Carotenoids (yellow-orange pigments) are present in an amount 2-6 times smaller than chlorophylls. The carotenoids consist mainly of xanthophylls (such as lutein, violaxanthin, zeaxanthin) and carotenoids (including-carotene). Each photosynthetic organism has a characteristic set of pigments, but
chlorophyll a is present in all of them. Phycobilins (phycoerythrin, phycocyanin and allophycocyanin)
are the dominant assistant pigments in algaes and cyanobacterias.
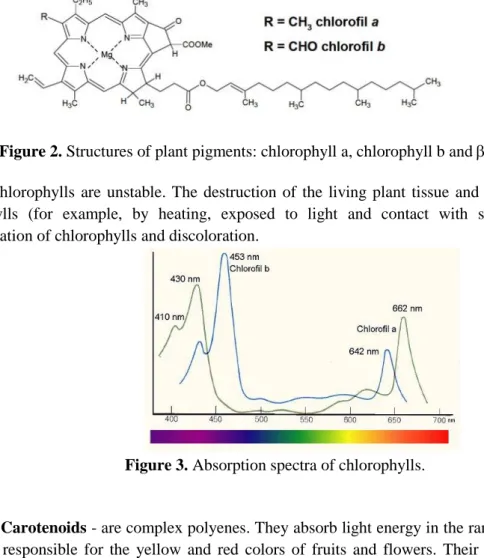
• Chlorophylls - belong to the porphyrin pigments. They comprise four interconnected pyrrole rings which connect centrally positioned magnesium atom. The difference in the construction of this kind of pigments is related with the position of specific group of atoms. Chlorophyll a has a methyl group, while chlorophyll b has a formyl group in the same place. The structure of chlorophyll molecules is shown in Figure 1.
Chlorophylls absorb light at wavelengths below 480 nm and between 550-700 nm, so the spectrum of chlorophylls, both a and b, have two maxima of absorption. These maxima can be moved in the direction of longer or shorter waves depending on the solvent. Cyan chlorophyll a absorbs mainly violet and red light; yellow-green chlorophyll b absorbs mainly blue and orange light. Light in the range between 480 and 550 nm (green) is reflected, hence the green color of plants is observed.
Figure 2. Structures of plant pigments: chlorophyll a, chlorophyll b and -carotene.
Chlorophylls are unstable. The destruction of the living plant tissue and the structure of the chlorophylls (for example, by heating, exposed to light and contact with solvent) leads to a transformation of chlorophylls and discoloration.
Figure 3. Absorption spectra of chlorophylls.
• Carotenoids - are complex polyenes. They absorb light energy in the range (450 - 500 nm).
They are responsible for the yellow and red colors of fruits and flowers. Their presence is usually masked by the intense green color of chlorophyll. When chlorophyll molecules are degraded in autumn then carotenoids give the leaves a beautiful red color
1
2
.
• Phycobilins - absorb red, orange, yellow and green light (in the wavelength range which the
chlorophylls partly do not absorb.
Pigments are poorly soluble in water, so organic solvents (eg ethanol, ether, acetone) are used for the extraction. Due to the nature of molecular structure and the length of the carbon chains in the molecule, they can be separated by chromatographic methods. It is possible to identify the individual pigments after expanding the chromatograph (qualitative analysis).
II. EXPERIMENTAL PART
1. Workplace
The workplace should include: - Chromatography Column - tripod - starch - Porcelain mortar - 2g of leaves - Ethyl alcohol - Petroleum ether - Diethyl ether - 5 tubes15ml - Weight - 2 tubes 50 ml (falcons) - pipettes 5ml, 1 ml - Pipette tips - centrifuge
- tripod for falcons - 1.5 ml eppendorfs - marker
- spectrophotometer - filter paper
The exercise must be performed in a lab coat and protective gloves.
2. Laboratory
1. Wash, weigh 1.5g and grind the plant material in the porcelain mortar.
2. Add 3 ml of ethyl alcohol and grind with the pestle for about next 5 minutes. Decant the
resulting suspension into 50ml tube, covered with aluminum foil.
3. Add 7ml of petroleum ether to the mortar and then extract pigments for 5 min. Again,
decant the suspension to the tube.
4. Wash the mortar with 2 ml of ethanol and pour the solution into the same tube. 5. Allow the tube with extract stay in room temperature for a few minutes in dark 6. Pour the extract to a new tube and centrifuge for 5 min, 10000 g. After centrifugation
transfer extract to clean tube.
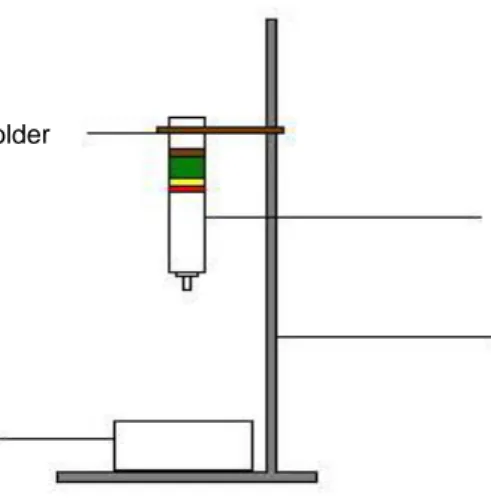
7. Place the chromatography column on a tripod vertically.
Figure 4. Scheme of the measuring position.
Holder
Column
Tripot
1
2 3
4 7. Place piece of filter paper at the bottom of the column.
8. Pour the starch into chromatography column (3/4) and place a piece of filter paper at the peak of the column
9 Pour 50 ml tubes to the level of 10 ml and add 15 ml of petroleum ether.
9. Wash the column with 10 ml of petroleum ether. Mind that the level of ether has to be always at least 0.5 cm above the starch level.
10. Prepare 10 ml of chromatographic eluent with petroleum ether: ethanol: ethyl ether in the ratio 93:2:5.
11. Place 2 ml of the plant extract on the top of the column. 12. Wash the column with the chromatographic eluent.
13 Observe the color bands appearing in the column and take the photo of a column.
14. When the lower band appears near the outlet of the column, start collecting fraction putting clean 1,5 ml eppendorfs under column outlet. Each fraction should contain approximately 0.5 ml of extract.
15. After collecting all fractions for further analysis, chose those, that have the most intense color.
16. Take all the fractions and whole extract of plant pigments to the spectrophotometer station. 17. Using the program Instrument Control measure the absorbance of the full plant extract in
two wavelengths: 649nm and 665 nm. As a reference sample use ethanol.
18. Prepare 5-fold dilutions of all fractions collected from chromatographic column in the 1,5 ml eppendorphs.
19. Using the program Wavescan plot a full spectrum of all fractions in the range of 350-750 nm.
3.
Compilation of the results1. Draw the spectrum of all fractions on the same graph. Based on the literature describe the spectrum of individual plant pigments.
2. Describe color bands on photograph corresponding to individual pigments. 3. Calculate the concentration of chlorophyll a and b using formula:
Chlorophyll a (12.9 xA665-3, 45xA649) x10x1 [μgx10ml-3 extract = μgxg-1 fresh weight] Chlorophyll b (21.99 xA649-5, 32xA665) x10x1 [μgx10ml-3 extract = μgxg-1 fresh weight] where: A649 - absorbance measured at 649 nm wavelength
A665-value of absorbance measured at a wavelength of 665 nm 4. Determine the ratio of chlorophyll a / b
Chlorophyll a = Chlorophyll b =
1
III. THE REPORT
The report should include:
1. Short introduction. 2. The aim of the exercise.
3. The table with the results and the observations. 4. Discussion and conclusions.
IV. ISSUES TO STUDY
1. Characteristics of plant pigments
2. Definitions of absorbance and transmittance 3. Chromatography as a research method