TRANSPORTATION UNDER DEPLORABLE ROAD
SAFETY AND SECURITY MAINTENANCE
Buliaminu Kareem*
* Department of Mechanical Engineering, Federal University of Technology, Akure, P.M.B. 704, Akure, Ondo State, 34001, Nigeria, Email: karbil2002@yahoo.com
Abstract The traditional linear programming model based on transportation system model seems impracticable in developing countries because of neglect of certain salient environmental factors such as deplorable state of road safety and security maintenance. A transportatioin system model is de-veloped by taking into consideration the identified environmental constraints. The severity of the road safety and security deplorability was measured from pot-holes generation and check-points mounting rate. The loss cost function due to this deplorability was formulated and its outcome was integrated into the traditional transportation model. Transportation schedule from depots to the retail stations of the petrol product of the Nigerian petroleum industry was used to test the efficacy of the model. The results showed that the new scheme was not in good agreement with the traditional approach in some test cases. The findings showed that the cost price of the item can be affected by the degree of deplorability of road safety and security maintenance.
Paper type: Research Paper Published online: 29 October 2012 Vol. 2, No. 4, pp. 367-376
ISSN 2083-4942 (Print) ISSN 2083-4950 (Online)
© 2012 Poznan University of Technology. All rights reserved.
1. INTRODUCTION
The traditional Linear Programming, LPbased transportation model, is highly
engrossed with many unrealistic assumptions such as good road, guaranteed safety and adequate security networks. In real-life situation many of these assumptions need to be relaxed when the model is to be applied to some strategic transportation problems. In many developing countries including Nigeria there is evidence of neglect in road maintenance, safety, and security. In such countries a promising transportation system, that will consider the salient constraints, is needed in arri-ving at a realistic judgement of fixing cost of transportation and price of goods. In order to achieve this lofty objective of minimising the cost price of transporting a public goods such as petrol (product of petroleum), a new system-transportation model, that takes care of the salient constraints, is developed and its outcome is compared with the conventional transportation model.
Petroleum (crude oil) is generally defined as liquid combustible minerals oc-curring in the earth’s sedimentary mantle (PPMC, 2000). The petrol is a product of crude oil (PPMC, 2000). Nigeria is blessed with abundant petroleum resources. Petroleum has attracted major oil companies including Texaco, Mobil, Agip, Total, National, Shell, Unipetrol, and Elf. A number of independent marketers were also sprung up across the country (PPMC, 2000; Green and Wind, 2007; Feinberg, 1993; Arinze and Banerje, 1989).
Independent marketers have complemented the marketing activities of the major oil dealers by allowing the petroleum products to get to the grass root. Petroleum products’ retail stations were located in rural, semi-urban and urban centres. Petroleum products are mostly manufactured in the country’s refineries located in Port-Harcourt, Warri and Kaduna cities. Piping systems of different capacities were used to facilitate distribution of petroleum products, through effective pumping, to twenty two (22) major oil depots spread across the country (PPMC, 2000). The
pipeline systems’ segment, length (km), diameter (inch), line-fill capacity ( 2
m )
and flow-rate (m2/hr) are adequate enough to provide required petroleum
products (PPMC, 2000).
The independent marketers loaded petroleum products from the depots in tankers, and transported them to their respective retail stations. End-users buy the products from the stations based on pump price. Despite this holistic and effective distribution arrangement, the end-users are still suffering from products’ high price as a result of inadequacy. Application of linear programming based transportation model will be a veritable tool in solving this lingering problem of transportation.
Transportation model in some quarters is defined as the most useful special-purpose algorithmic tool that is more efficient than the linear programming based simplex method (Taha, 2008; Gal and Nedona, 2001; Basu, 1989; Austin and Burns, 1985). In literature, transportation model has been described as a special case of linear programming model (Harold, 2006; Eckenrode, 2003; Leven, Rubin,
Simpson & Gardener, 1989). Previous work has extended the use of transportation model in electronic computers in the areas of minimizing time and cost of locating processing units (Fernando, Podrebarac & Sengupta, 2006; Goodman and Ralph, 2001; Feinberg, 1993; Arinze and Banerje, 1989). In transportation model total supplied is assumed to be equal to total demanded. Practically, this balanced condition is rare (Taha, 2008; Wheelwright 2008; Grant and Eugene, 1989). However, the use of balanced system will enable a good idea of how best the cost of transportation can be minimized in the heterogeneous network flow problems (Grant and Eugene, 1989; Shepard, 2001). Transportation model has been proved reasonable and effective in minimizing the cost of transportation of goods (Shepard, 2001). However, many of these models failed to consider many other possible constraints that may face transportation system. There is need for a study that will take care of this deficiency in order to arrive at a realistic cost of transportation. The rest of paper is presented thus: conventional and modified transportation models are presented in Section 2, validation procedures are presented in Section 3, results and discussion is in Section 4 while Section 5 presents conclusion. The paper ends with acknowledge and the list of references.
2. MATERIALS AND METHODS
2.1. Conventional transportation model formulation
The cost of distribution of petroleum products from the source (depot) to the destination (station) is minimized using linear programming based transportation
model. In the transportation model, there are M sources and N destinations.
Each source (
i
) possessesa
i item (petroleum product), and each destination (j
)requires
b
j item. The problem is how the item be distributed from the source to thedestination such that the cost of transportation is minimized. Diagrammatic representation of the transportation problem is shown in Fig. 1.
Fig. 1 Representation of the Transportation Problem
N
destinations, each requires j b item M sources, each possesses ia
itemLet,
ij
x = the amount transported from depot
i
to stationj
ij
c = unit cost of transporting petroleum products from depot
i
to stationj
The mathematical statement of the transportation problem is, Minimize (sum of transportation cost):
M i N j ijc
1 1 ij x (1) Subject to:
M i ij x 1=
b
j,
j (all demands are met) (2)
N j ijx
1=
a
i,i (all supplies are used) (3)ij
x
0, j (4)2.1. Modified transportation system formulation
In the transportation model, there are M sources and N destinations. Each
source (
i
) possessesa
i item (petroleum product), and each destination (j
)requires bj item. The problem is how the item be distributed from the source to the
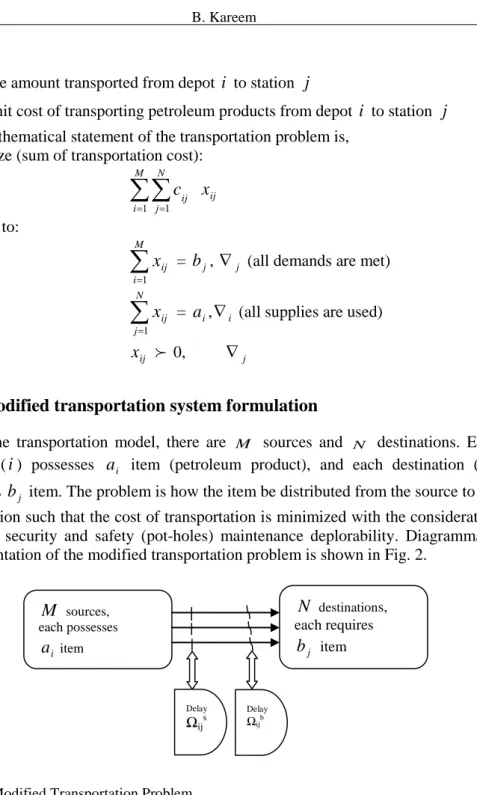
destination such that the cost of transportation is minimized with the consideration of road security and safety (pot-holes) maintenance deplorability. Diagrammatic representation of the modified transportation problem is shown in Fig. 2.
Fig. 2 Modified Transportation Problem
Let, N destinations, each requires j
b
item M sources, each possesses ia
item Delay Ωijs Delay Ωijbij
x = the amount transported from depot
i
to stationj
ij
c = unit cost of transporting petroleum products from depot
i
to stationj
s ij
= unit cost of security deplorability of transporting petroleum products fromdepot
i
to stationj
b ij
= unit cost of safety deplorability (bad road segiments) of transportingpetroleum products from depot
i
to stationj
k = number of security check-points predicted
y = number of bad road-segments predicted
The mathematical statement of the transportation problem based on the modification in Fig. 2 is,
Minimize (sum of transportation cost):
)
(
1 1 b ij s ij M i N j ijk
y
c
ij x (5) Subject to:
M i ijx
1= bj, j (all demands are met) (6)
N j ijx
1=
a
i,i (all supplies are used) (7)ij
x
0,
j (8)The most paramount hypothesis is to test null hypothesis that there is a significant different between the cost of transportation using the traditional method and the modified transportation method. The alternative hypothesis is that there is no significant different between the two methods
3. SYSTEMS VALIDATION
Many studies have provided special algorithms that facilitate efficient solution to traditional transportation model (Taha, 2008); (Gal & Nedona, 2001); (Basu, 1989); (Yu & Zeleny, 2002). For easy and rapid application in industries the new model requires a modified computerized solution too. Therefore, a special linear programming based transportation model software package was developed using Microsoft Visual Basic 6.0 integrated development environment.
Data, including transportation cost per litre and road distances from depots to stations, used for model testing were extracted from identified petroleum related publications including bulletin, annual reports and journals (PPMC, 2000; Green
and Wind, 2007; Feinberg, 1993). The cost of transportation between the depots was estimated by calculating the average cost per kilometre (km) for selected depots from the average distances to the stations (Arinze and Banerji, 1989). Table 1 shows the cost of transporting a litre of petrol from the selected depots to station in Akure city, Nigeria, with the average distances (in km) apart. The cost of tran-sportation to other depots was estimated from the product of average cost per km and the distance apart. The optimal solution of the transshipment (allocation) problem was shown in Table 3 using traditional/conventional transportation method.
Table 1 Estimation of transportation cost per litre of petrol
Depots Station Cost of transportation per litre (N / litre)
Cost of transporting 33,000 litres (N) Distance in km Ore Akure 0.80 26,400 92 Benin Akure 1.00 33,000 171 Ibadan Akure 1.00 33,000 200
Average cost, and distance 30,800 154.33
Average cost per km (N/km) 199.57
In Nigeria security check-points are mounted at varying distances but in most cases it was not less than 10 km interval. In order to limit the levels of bias in transportation cost estimate, it is reasonable to base the cost estimate on the mini-mum in order to allow for bargaining between the passenger and the transporter.
Table 2 Estimation of unit cost of road deplorability
Depots Station Cost incurred in checkpoi nt or bad road (N) Distance in km Numbe r of check pointk Numbe r of bad road segment y Unit cost per security check point s ij
Unit cost per bad road segment b ij
Ore Akure 2,640 92 9 12 2.21 1.66 Benin Akure 3,300 171 17 23 1.17 0.86 Ibadan Akure 3,300 200 20 26 0.99 0.76 Average cost, and distance 3,080 154.33 15 20Average cost per
km (N/km) 19.95 Average cost per km per check point or segiment 1.33 0.99 1.45 1.09
This minimum security cost assumption will allow the transporter to be sure of delivering the goods without fair of loss, and at the same time allow the customer
to know how much to charge the end-users in order to guard against any loss. In the case of bad road, similar condition was considered in estimating the cost in-curred in transportation due to delay caused by bad road-segments. The difference between delays due to deplorable security and bad road-segiments maintenance is that the number of failed segments of road was more than number of mounted check-points. It was observed that the failed portions of roads are located between the ranges of 5 km to 10 km apart. Based on balanced probability, the average of these two extreme values (that is, 7.5 km) will be reasonably chosen as a good esti-mate for determining the cost of delay due to bad state of road. The cost of delay per security check-point was estimated by dividing the cost of transpor-tation per litre per km with the respective kilometre distances of location of security check-point (Table 2). The results of the analysis using the old and new schemes are pre-sented in Table 3.
Table 3 Optimal allocation of petrol using traditional and new schemes
Source / Depots Destina tions/ Stations Optimal cost, N (in Nigeria currency) (traditi onal) Optimal cost, N (in Nigeria currency) (new scheme) Optimal item allocatio n (in ‘000) litres Optim al distanc e (in km) Minim um cost, N of chosen wrong route Minimu m Cost savings, N(traditi onal) Minimu m Cost savings, N (new scheme) Aba Owerri 20,356 20,399 245 102 24,000 3,644 3,600 Port-Harcourt 12,772 12,815 89 64 11,228 11,184 Uyo 20,356 20,399 11 102 3,644 3,600 Benin Abakaliki 49,493 49,536 52 248 64,000 14,507 14,463 Asaba 27,740 27,783 87 139 36,260 36,216 Awka 33,129 33,172 150 166 30,871 30,827 Enugu Umuahia 30,335 30,378 117 152 34,000 3,665 3,621 Calabar Enugu 47,498 47,541 123 238 59,000 11,522 11,458 Uyo 9,978 10,021 123 50 49,022 48,978 Gombe Yola 52,686 52,729 218 264 60,000 7,314 7,270 Gusau Birni-Kebbi 50,092 50,135 88 251 70,000 19,908 19,864 Katsina 41,511 41,554 150 208 28,489 28,445 Ibadan Abeokuta 15,367 15,410 234 77 106,00 0 90,633 90,589 Ilorin Ibadan 31,732 31,775 87 159 62,000 30, 268 30, 224 Jos Abuja 62,465 62,508 200 313 85,000 22,535 22,491 Bauchi 26,343 26,386 212 132 58, 657 58, 613 Kano 84,019 84,086 16 421 981 937 Lafia 47,498 47,541 139 238 37,502 37,458 Kano Bauchi 64,062 64,062 123 321 88,000 23,938 23,894 Dutse 27,142 27,142 63 136 60,858 60,814 Gusau 64,860 64,905 123 325 23,140 23,096 Kaduna 52,287 52,330 125 262 35,713 35,669 Katsina 34,526 34,569 220 173 53,474 53,430
Lagos Birni-Kebbi 164,845 164,888 136 826 193,000 28,155 28,111
Ilorin 61,068 61,111 153 306 131,932 131,888 Makurdi 163,647 163,690 275 820 29,353 29,309 Sokoto 209,548 209,591 59 1,050 83,452 -16591 Maidug uri Damaturu 25,944 25,987 400 130 174,00 0 148,056 148,012 Gombe 95,993 96,036 246 481 78,007 77,963 Kano 122,536 122,579 72 614 51,464 51,420 Yola 81,624 81,667 27 409 92,376 92,332 Makur di Abakaliki 53,684 53,727 110 269 206,00 0 152,316 152,272 Enugu 53,884 53,927 124 270 152,116 152,072 Gudau 152,471 152,471 97 764 53,529 53,485 Kano 151,673 151,716 48 760 52,327 54,283 Lafia 19,957 20,000 150 100 186,043 185,999 Lokoja 63,663 63,706 155 319 142,337 142,293 Maiduguri 186,598 186,641 63 935 16,402 19,358 Sokoto 196,576 196,619 150 985 9,402 9,380 Minna Abuja 23,350 23,393 124 117 59,000 35,650 35,606 Mosimi Abeokuta 12,772 12,815 217 64 16,000 3,228 3,184 Ibadan 15,367 15,410 329 77 633 589
Ore Ado Ekiti 27,940 27,983 256 140 39,000 11,050 11,016
Akure 18,360 18,403 234 92 20,640 20,596 Ilorin 38,118 38,161 47 191 889 838 Osogbo 23,549 23,592 150 118 15,451 15,407 Suleja Lokoja 27,541 27,584 95 138 35,000 7,459 7,415 Minna 23,350 29,393 250 117 11,650 5,606 Yola Jalingo 28,339 28,382 112 142 81,000 52,661 52,617 Atlas-Cove Ibadan 29,337 29,380 200 147 47,000 17,663 17,619 Port-Harcou rt Abakaliki 13,770 13,813 50 69 19,000 5,230 5,186 Yenegoa 8,981 9,024 150 45 10,019 9,975 Kaduna Abuja 35,923 35,966 76 180 67,000 31,077 31,033 Gusau 56,279 52,322 17 282 10,721 14,677 Jos 55,880 55,923 107 280 11,120 11,076 Warri Asaba 17,762 17,805 200 89 21,000 3,238 3,194
4. RESULTS AND DISCUSSION
The results obtained using the 22 depots, spread all over the country, as the sources and the 37 stations in major cities as the destinations, are shown in Table 3. From the results, it was discovered that the available depots can supply petrol to the retail stations at minimum transportation cost. Based on traditional approach, a minimum cost required for the transportation of petrol in a unit month from the depots to the stations is N 396,744,332. In this allocation, Markurdi recorded the highest supply while Warri depot had the least supply to the stations. Many routes were unused because they attracted high cost of transportation. A cost savings ranging from 4 to 86 % was achieved with the application of the conventional model over unplanned choice of routes. In the case of new scheme there was a slight decrease in percentage cost savings’ results (Table 3). Application of the new
model showed that there was some monetary sacrifice in the part of transporter which undermined the actual cost of the products. However, it was clearly shown form the new scheme that difference may be significant at high values of k and y. Therefore, the concerned authority should limit the values of k and ysuch that the optimal cost of transportation would not be increased substantially. This would guard against shortage, and high cost of petrol.
5. CONCLUSION
In this study a linear programming based transportation model was used to solve transportation problem related to petroleum product distribution among Nigerian depots and stations with deplorable road safety and security maintenance. The traditional transportation model and its modified form were solved through computer software package in Microsoft Visual Basic (VB 6.0) integrated development environment (complier). The model was tested and implemented with data obtained from selected Nigerian depots and stations of the Petroleum Company. It can be concluded from the results that there were substantial cost savings from the use of the proposed models (new scheme) over the former unplanned (traditional) approach used by the company. Besides, good price per litre of petrol could be arrived at which will be fair for petrol dealers, transporters, customers and end-users.
ACKNOWLEDGEMENTS
Author wish to acknowledge the support given by the management of the Federal University of Technology, Akure, Nigeria in providing facilities used for this study
REFERENCES
Arinze, B., & Banerje A. (1989). “A knowledge-based approach for facilities location planning”. Department of Management, Drexel University, Philadelphia.
Austin, M.L., & Burns J.R. (1985). “Management Science and Aid for Managerial Design Making”. Macmillan Publishing Company, New York.
Gal, T., & Nedona, J. (2001). “Multi-parametric linear programming”. [in:] Management Science, Vol. 18, No. 7, pp. 17-20.
Basu, P.B. (1989). “Operation Research for Engineers”. Oxford and IBH Publishing Company Ltd, New Delhi.
Eckenrode, R.T. (2003). “Weighting multiple criteria”, [in:] Management Science, Vol. 12, No. 3, pp 180-192.
Feinberg, A. (1993). “An experimental investigation of an interactive approach for multi-criteria optimization with application to academic resources allocation”, Working
Paper, N. 186, Western Management Science Institute, University of California at Los Angeles.
Fernando, T.D.H., Podrebarac, M.L., & Sengupta, S.S. (2006). “Probabilities with multi-objectives linear programmes”. Working Paper, No. 63, Department of Management Science, University of Water Loo, pp 132-138.
Goodman, L.J. & Ralph, N.L. (2001). “Project Planning and Management: an Integrated Approach”. Pergamon, Press, New York.
Grant, I.E., & Eugene, L. (1989). “Handbook of Industrial Engineering and Management”. Prentice-Hall of India Private Ltd., New Delhi.
Green, P.E., & Wind, Y. (2007). “Multi-attribute Decisions in Marketing: a Measurement Approach”. Holt, Rinehart and Winson, New York.
Harold, E.F. (2006). “Organizational relationships in purchasing”. [in:] Journal of Purchasing, and Materials Management, Vol. 20, No. 3, pp 3-12.
Levin, R.L., Rubin, D.S., Simpson, J.P., & Gardener, E.S. (1989). “Quantitative approach to management”. McGraw-Hill Book Company, new York.
Noble, D.H., & Ademosun, O.C. (1984). “The Nigeria oil palm industry processing unit”. Federal University of Technology, Akure, Nigeria.
PPMC (2000). “Pipeline and products marketing company limited”. [in:] Bulletin and Profile, Port-Harcourt, Nigeria.
Shepard, R.N. (2001). “On subjectively optimum selection among multi-attribute alternatives”, in M.W. Shelly and G.L. Bryan, eds.; Human Judgment and Optimality, pp 279-280, Wiley, New York.
Taha, H.A. (2008). “Operations Research: an Introduction”. [in:] Prentice-Hall of India Private Ltd, New Delhi.
Wheelwright, S.C. (2008). “Manufacturing strategy: defining the missing link”, [in:] Strategic Managerial Journal, Vol. 5, pp 71-91.
Yu, P.L., & Zeleny, M. (2002). “On some linear multi-parametric programme”. [in:] Centre for System Science, University of Rochester, New York.
BIOGRAPHICAL NOTES
Buliaminu Kareem is a Senior Lecturer at the Federal University of Technology,
Akure, Nigeria. He teaches engineering management courses such as Operations Research, Work Study, Production and Maintenance Management. His research in-terests are Industrial/Production Systems Design, Optimisation and Maintenance. He is a reviewer to many reputable journals including European Journal of Opera-tional Reseach and Internation Journal of Management Science. His papers appear in numerous journals including Journal of Computing, Internet and Management, Thailand, and Journal of Applied Mathematics and Bioinformatics, Greece.

![""Ksiądz Marek" Słowackiego a "sprawa Boża"", Andrzej Boleski, Varsaviae 1922 : [recenzja]](data:image/gif;base64,R0lGODlhAQABAIAAAP///wAAACH5BAEAAAAALAAAAAABAAEAAAICRAEAOw==)