TRENDS
in
Sport Sciences
2020; 27(4): 213-218 ISSN 2299-9590 DOI: 10.23829/TSS.2020.27.4-4 Received: 14 August 2020 Accepted: 16 September 2020Corresponding author: ytakana@juntendo.ac.jp
1 Juntendo University, School of Health and Sports Science,
Department of Sports Science, Inzai, Japan
2 Juntendo University, Graduate School of Health and Sports
Science, Inzai, Japan
YUTA TAKANASHI1, YOSHIMITSU KOHMURA1, KAZUHIRO AOKI2
Effectiveness of explosive sprint and pedaling exercises
for physical fitness assessment of throwers
Introduction
F
or a thrower, increasing the release velocity is crucial [2, 3, 6, 7, 9, 11, 17, 18] for distance determination. Field tests are important as events reflecting the specificity of the sport [13]. As explosive muscle strength is required for the thrower, field tests can be performed as an evaluation method. Field tests have been used almost since the 1980s [4, 12]. For instance, backward throw [1, 10, 15, 20-23], standing long jump and standing triple jump [8, 10, 15, 20, 21]. However, the reliability of the 30-m sprint and bicycle ergometer tests, widely used as an indicator of the explosive muscle capabilities of the leg, has not been studied for the physical fitness assessment of throwers. Although some reports indicated that the 30-m sprint is a useful measurement event [23], no significant association exists with the athletic performance [20]. A useful report for the physical fitness evaluation discussing throwing in particular events was presented [15]; however, the relationships presented in the report are not effective for the physical fitness evaluation of hammer throwers [10]. In this regard, the following two problems could be why a unified opinion has not been obtained on the relationship between sprint and competitive abilities. First, whether the running time for a sprint distance of 30 m is appropriate or not is not clear for the physical fitness assessment of throwers. Studies using distances shorter than 30 m (20 yds, approximately 18.188 m [16])Abstract
Introduction. The reliability of the 30-m sprint and bicycle ergometer tests, which are widely used as an indicator of the explosive muscle capabilities of the leg, has not been studied for the physical fitness assessment of throwers. Aim of Study. This study aimed to clarify whether the sprint and bicycle ergometer tests at short operating times are useful for assessing the competitive performance in the throwing competition. Material and Methods. For 11 male university students, the highest rotation speed (1, 2, 3 s each) was measured at three different loads during a 10-yd running time and bicycle ergometer test (1, 2, 3 s each). The relationship between the measured value and the competitive force (IAAF score) was examined. Results.
The results can be summarized as follows: 1) no significant correlation was found between the 10-yd sprint time and athletic performance. 2) A positive correlation between the body mass and the number of revolutions was found so that weight positively affects the maximum rotational speed. 3) A positive correlations were found between the maximum numbers of revolutions at 3 s for each loading condition. Conclusion.
These results suggest that (1) the sprint test is unsuitable for throwers, and (2) the maximum pedaling speed for a short period (1.0-2.0 s) with a relatively high load (5.0 kgf) is useful. KEYWORDS: 30-m sprint test, bicycle ergometer, physical fitness assessment, throwers.
or long distances (100 m [15]) have been reported. However, optimal distance has not been determined. The second problem is the effect of the body mass of the thrower. For a thrower, a large physique is a beneficial factor, as well as having a great force to carry heavy objects. Therefore, sprint tests are considered not suitable for physical fitness evaluation because body mass negatively affects these tests. If this is the case, the bicycle ergometer that is not affected by body mass may be more suitable for evaluating physical fitness. The power ability of the bicycle ergometer is often evaluated through two variables: the maximum rotational speed and the maximum anaerobic power. In the maximum rotational speed test, the maximum rotational speed during pedaling at a lightweight load of 1.0 kgf is measured. Alternatively, in the maximum anaerobic power test, the maximum effort pedaling at 10 s is obtained through three sets between 60 s of rest at three loads that are gradually increased. A significant correlation between the athletic performance and the power ability measured was reported using a bicycle ergometer in the shot put [14] and the javelin throw [5]. Furthermore, conflicting results have been observed in studies based on multi-event throwers. A study measuring the power performance before and after the off-season for college students reported that the maximum anaerobic power showed a positive correlation with the athletic performance before and after the off-season. Moreover, the study reported that a positive correlation existed between athletic performance and the maximum rotational speed only before the off-season [19]. Aoki et al. [1] suggested that no association exists between the maximum anaerobic power and competitive ability. The problem of testing using a bicycle ergometer was the type of exercise because the throwing event requires assessing the instantaneous power. However, the maximum anaerobic power test and maximum rotational speed test were performed for approximately 10 s. Therefore, the characteristics of throw events require a method where the movement ends in a shorter time.
From these points, if the operation time of the sprint and bicycle ergometer test is set to a shorter time, it may become a reliable test. However, no research has focused on this regard. This study examines whether the sprint and bicycle ergometer tests with short operating times are useful for evaluating the athletic performance in throwing competitions.
Aim of Study
The purpose of this study was to clarify if the sprint and bicycle ergometer tests at short operating times are
useful for assessing the competitive performance in the throwing competition.
Material and Methods
Subjects
The subjects were 11 male student-athletes specialized in throwing (age: 19.64 ± 0.88 years old, height: 177.49 ± 5.45 cm, weight: 92.29 ± 17.24 kg), 2 in discus throws, 2 in shot puts, 3 in hammer throws, and 4 in javelin throws. Moreover, the study considered 8 people who had participated in nationwide scale competitions and 3 people who did not. Five out of the former throwers had won the competition on a nationwide scale. To consider competition standards, we adopted the best score of the season in 2019. The competition standard was 786.00 ± 50.37 points in terms of the IAAF score.
The purpose and methods of the study were explained to the subjects. Informed written consent for the experiment participation was obtained. Before conducting the experiments, the Graduate School of Sports and Health Sciences, Juntendo University, received a research ethics review and obtained approval (No. 31-91).
Procedures and measurements
Measurement time and location
This experiment was conducted at Juntendo University Sakura Campus. The measurements were performed in three parts between February and March 2020.
Ten-yd sprint
An electric time gate (TCi Timing System, Brower Timing Systems) was used to measure the 10-yd sprint time. An electric time gate was installed at the height of 100 cm from the floor on the start and goal lines. The participants were prepared by setting the forefoot at the mark 30 cm behind the start line. The time was measured with a precision of one-hundredth of a second. The measurement was performed twice, and the best measured time was adopted. Maximum rotational speed in the bicycle ergometer Power MAX VIII (Konami Sports Co., Ltd.) was used to measure the maximum rotational speed in the bicycle ergometer. Three types of loads were used, namely, 1, 3, and 5 kgf. Three types of motion times were set for 1, 2, and 3 s at each load, and 9 events (1-kgf-1-s, 1-kgf-2-s, 1-kgf-3-s, 3-kgf-1-s, 3-kgf-2-s, 3-kgf-3-s, 5-kgf-1-s, 5-kgf-2-s, and 5-kgf-3-s) were measured. All the pedaling tests started from a stationary state. The participants were not allowed to lift their hips from the saddle when pedaling. The measurements were
performed randomly and separated by three days. The data was recorded twice for each measurement.
Statistical analysis
The statistics are shown as the mean ± standard deviation. Pearson’s correlation coefficient was used to test correlations between measurements. Moreover, the risk rate was less than 5%.
Results Ten-yd sprint
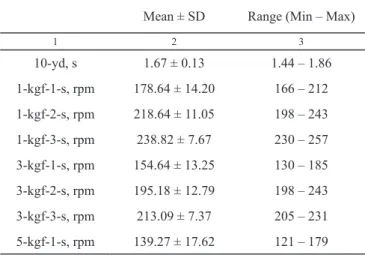
The average time of the 10-yd sprint was 1.67 ± 0.13 s (Table 1). No significant correlations were found between the 10-yd sprint time and the IAAF scores (Figure 1). Maximum rotational speed in the bicycle ergometer The results of the maximum rotational speed in the bicycle ergometer test are listed in Table 1.
Table 1. Results from the 10-yd sprint and maximum revolution
in the bicycle ergometer
Mean ± SD Range (Min – Max)
1 2 3 10-yd, s 1.67 ± 0.13 1.44 – 1.86 1-kgf-1-s, rpm 178.64 ± 14.20 166 – 212 1-kgf-2-s, rpm 218.64 ± 11.05 198 – 243 1-kgf-3-s, rpm 238.82 ± 7.67 230 – 257 3-kgf-1-s, rpm 154.64 ± 13.25 130 – 185 3-kgf-2-s, rpm 195.18 ± 12.79 198 – 243 3-kgf-3-s, rpm 213.09 ± 7.37 205 – 231 5-kgf-1-s, rpm 139.27 ± 17.62 121 – 179 1 2 3 5-kgf-2-s, rpm 178.36 ± 17.22 138 – 206 5-kgf-3-s, rpm 194.18 ± 11.52 178 – 218 Note: 1-kgf-1-s indicates that subjects pedaled a cycle ergometer with maximum effort for 1 sec at 1 kgf; 10-yd – 10 yard sprint
No significant associations were found between all measurement items for 1 kgf and 3 kgf and the IAAF scores (Figures 2 and 3). Conversely, significant positive correlation was observed between the maximum rotational speed in the bicycle ergometer and the IAAF score in 5-kgf-1-s (r = 0.626, p < 0.05) and 5-kgf-2-s (r = 0.603, p < 0.05) (Figure 4).
Note: 1-kgf-1-s – maximum effort for 1 s at 1 kgf; 1-kgf-2-s – maximum effort for 2 s at 1 kgf; 1-kgf-3-s, maximum effort for 3 s at 1 kgf
Figure 2. Correlation between the athletic performance and
maximum effort at 1 kgf
Note: 3-kgf-1-s – maximum effort for 1 s at 3 kgf; 3-kgf-2-s – maximum effort for 2 s at 3 kgf; 3-kgf-3-s – maximum effort for 3 s at 3 kgf
Figure 3. Correlation between the athletic performance and
maximum effort at 3 kgf
Figure 1. Correlation between the athletic performance and
Relationships between measured variables
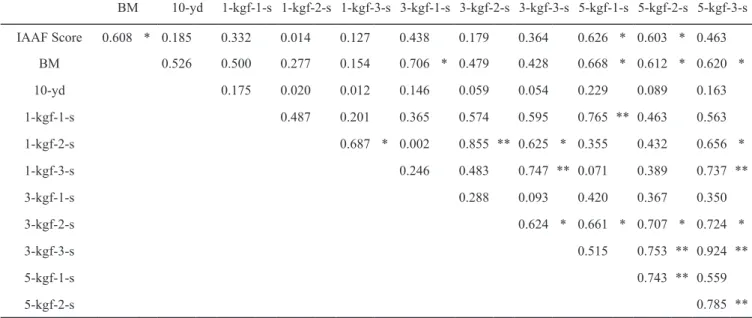
The correlation coefficients between each measured variables are listed in Table 2. Body mass and 3-kgf- -1-s (r = 0.706, p < 0.05), 5-kgf-1-s (r = 0.668, p < 0.05), 5-kgf-2-s (r = 0.612, p < 0.05), and 5-kgf-3-s (r = 0.620, p < 0.05) presented positive correlations. No
significant correlations were found between the 10-yd sprint and any of the measurement variables.
At the maximum rotational speed in the bicycle ergometer, correlations were observed between multiple variables. Specifically, the highest correlation coefficients were found between 3-kgf-3-s and 5-kgf-3-s (r = 0.924, p < 0.01). Moreover, a positive correlations were found between the maximum numbers of revolutions at 3 s for each load in all combinations. Specifically the correlations were found for 1-kgf-3 vs 3-kgf-3 (r = 0.747, p < 0.01), 1-kgf-3 vs 5-kgf-3 (r = 0.737, p < 0.01), and 3-kgf-3 vs 5-kgf-3 (r = 0.924, p < 0.01).
Discussion
In this experiment, the hypothesis that the competitive capacities in a throwing competition can be evaluated by setting the exercise time shorter than the sprint and bicycle ergometer test was verified. Until now, the 30-m running test has been used for sprint tests. The results showed that even if the running distance is reduced to 1/3 of the 30-m running test, approximately 10 yds, the test would not be useful for the physical fitness assessment of throwers. Takanashi [19] noted that body mass is the reason for the lack of a significant correlation between the 30-m sprint time and competitive capacities. In this experiment, the general tendency that a positive correlation between the time and
Table 2. Correlation coefficient between the measured variables
BM 10-yd 1-kgf-1-s 1-kgf-2-s 1-kgf-3-s 3-kgf-1-s 3-kgf-2-s 3-kgf-3-s 5-kgf-1-s 5-kgf-2-s 5-kgf-3-s IAAF Score 0.608 * 0.185 0.332 0.014 0.127 0.438 0.179 0.364 0.626 * 0.603 * 0.463 BM 0.526 0.500 0.277 0.154 0.706 * 0.479 0.428 0.668 * 0.612 * 0.620 * 10-yd 0.175 0.020 0.012 0.146 0.059 0.054 0.229 0.089 0.163 1-kgf-1-s 0.487 0.201 0.365 0.574 0.595 0.765 ** 0.463 0.563 1-kgf-2-s 0.687 * 0.002 0.855 ** 0.625 * 0.355 0.432 0.656 * 1-kgf-3-s 0.246 0.483 0.747 ** 0.071 0.389 0.737 ** 3-kgf-1-s 0.288 0.093 0.420 0.367 0.350 3-kgf-2-s 0.624 * 0.661 * 0.707 * 0.724 * 3-kgf-3-s 0.515 0.753 ** 0.924 ** 5-kgf-1-s 0.743 ** 0.559 5-kgf-2-s 0.785 **
Note: BM – body mass; 10-yd – 10 yard sprint; 1-kgf-1-s – maximum effort for 1 s at 1 kgf; 1-kgf-2-s – maximum effort for 2 s at 1 kgf; 1-kgf-3-s – maximum effort for 3 s at 1 kgf; 3-kgf-1-s – maximum effort for 1 s at 3 kgf; 3-kgf-2-s – maximum effort for 2 s at 3 kgf; 3-kgf-3-s – maximum effort for 3 s at 3 kgf; 5-kgf-1-s – maximum effort for 1 s at 5 kgf; 5-kgf-2-s – maximum effort for 2 s at 5 kgf; 5-kgf-3-s – maximum effort for 3 s at 5 kgf
* p < 0.05, ** p < 0.01
Note: 5-kgf-1-s – maximum effort for 1 s at 5 kgf; 5-kgf-2-s – maximum effort for 2 s at 5 kgf; 5-kgf-3-s – maximum effort for 3 s at 5 kgf, * p < 0.05
Figure 4. Correlation between the athletic performance and
body mass of 10-yd sprints was present; however, it was not significant (p = 0.096). Moreover, the two subjects with the worst performance in the 10-yd runs were the heaviest people in terms of body mass. As one of them had multiple prizes in a nationwide competition, the sprint test is considered as unsuitable for evaluation in the field test. Conversely, for 3-kgf-1-s, 5-kgf-1-s, 5-kgf-2-s, and 5-kgf- -3-s, the positive correlation between the body mass and the number of revolutions showed that weight positively affects the maximum rotational speed. In the relationship with the IAAF score, a positive correlation was found between 5-kgf-1-s and 5-kgf-2-s. Nevertheless, considering that the same relationship was not observed for 1 kgf and 3 kgf loads and 5-kgf-3-s, a short test at 5 kgf is considered to reflect the characteristics of the projection competition, which requires the projection of certain heavy objects in a very short time, rather than moving rapidly [10]. In this regard, it is interesting that the correlation coefficient with the IAAF score was high in the following order of 5-kgf-1-s> 5-kgf-2-s> 5-kgf-3-s. Moreover, a physical strength element different from the test of 3 s is required for the test of 3 s because a positive correlation was observed between the maximum rotational speed in the bicycle ergometer of 3 s for each load. No significant association with the IAAF score was found regardless of the difference in load during 3 s of pedaling.
These results suggest that the sprint test is not suitable for event throwers. The maximum pedaling speed for a short time (1.0-2.0 s) is useful at a relatively high load (5 kgf). In the future, it is necessary to consider pedaling tests with larger loads.
Conflicts of Interest
The authors declare no conflict of interest.
References
1. Aoki K, Kohmura Y, Sakuma K, Koshikawa K, Naito H. Relationships between field tests of power and athletic performance in track and field athletes specializing in power events. Int J Sports Sci Coach. 2015;10(1):133- -144.
2. Bartlett RM. The biomechanics of the discus throw: a review. J Sports Sci. 1992;10(5):467-510.
3. Best RJ, Bartlett RM, Morriss CJ. Three-dimensional analysis of javelin throwing technique. J Sports Sci. 1993;11(4):315-328.
4. Borgstrom A. Javelin throwing in Sweden-training and methods of evaluation. Thrower. 1989;46:56-59.
5. Bouhlel E, Souhaiel M, Tabka Z, Shephard R. Relationships between maximal anaerobic power of the
arms and legs and javelin performance. J Sports Med Phys. 2007;47(2):141-146.
6. Dapena J. The pattern of hammer head speed during a hammer throw and influence of gravity on its fluctuation. J Biomech. 1984;17(8):553-559.
7. Gregor RJ, Whiting WC, McCoy RW. Kinetic analysis of Olympic discus throwers. Int J Sport Biomech. 1985;1(2):131-138.
8. Hatakeyama S, Takanashi Y, Sasaki D. An investigation into characteristics of physical fitness in discus throwers. Res Q Athletics 2011;87:7-26 (in Japanese, English abstract). 9. Hay JG. The Biomechanics of Sports Techniques (3rd
edition). Englewood Cliffs: Prentice-Hall; 1985.
10. Hirose K, Takanashi Y, Aoki K, Kaneko K. Relationship between hammer throw performance and field tests: focus on the kettlebell throw. Res Q Athletics. 2013;92:38-44 (in Japanese, English abstract).
11. Hunter I, Kiggore G. Release velocity and angle in men’s and women’s hammer throw. Track Coach. 2003;162:5180- -5181.
12. Jones M. The test quadrathlon. Track Field Q Rev. 1988;88:43-46.
13. Joyce D, Lewindon D. High-Performance Training for Sports. Champaign: Human Kinetics; 2014.
14. Landolsi M, Bouhlel E, Zarrouk F, Lacouture P, Tabka Z. The relationships between leg peak power and shot-put performance in national-level athletes. Isokinet Exerc Sci. 2014;22(1):55-61.
15. Maeda K, Ohyama K, Hirose K, Ogata M. Relationships between throwing distance and parameters about morphology and physical strength in male discus throw: estimating physical strength requirement corresponding to throwing distance. Japan J Coach Stud. 2018;31(2):175-184 (in Japanese, English abstract). https://doi.org/10.24776/jcoaching.31.2_175.
16. Morrow RJ, Disch JG, Ward EP, Donovan TJ, Katch IF, Katch LV, et al. Anthropometric, strength and performance characteristics of American world class throwers. J Sports Med. 1982;22:73-79.
17. Murakami M, Tanabe S, Ishikawa M, Isolehto J, Komi PV, Ito A. Biomechanical analysis of the javelin at the 2005 IAAF World Championships in Athletics. New Stud Athletics. 2006;21(2):67-80.
18. Sugumar CA. Biomechanical analysis of the shot put performance. Global J Res Anal. 2014;3(5):118-119. 19. Takanshi Y. Relationship between throwing performance
and characteristics of physical fitness in female college throwers. Bulletin of Tokyo Women Collage of Physical Education. 2009;44:49-53 (in Japanese, English abstract). 20. Takanashi Y, Kohmura Y, Aoki K, Yonamoto M, Kaneko K.
by a field-test in female college throwers. Res Q Athletics. 2009;79:30-38 (in Japanese, English abstract).
21. Takanashi Y, Kohmura Y, Aoki K, Yonamoto M, Kaneko K. Relationship among throwing performance, anaerobic power and Test QUADRATHRON in female college throwers. Res Q Athletics. 2009;76:39-44 (in Japanese, English abstract).
22. Terzis G, Karampatsos G, Georgiadis G. Neuromuscular control and performance in shot-put athletes. J Sports Med Phys Fitness. 2007;47(3):284-290 (in Japanese, English abstract).
23. Zaras N, Stasinaki AN, Arnaoutis G, Terzis G. Predicting throwing performance with field tests. New Stud Athletics. 2016;31(3/4):9-19.