A
RGUMENT
A
O
ECONOMIC
A
2 (35)
•
2015
Wrocław University of Economics
Wrocław 2015
Editors
Ewa Knichnicka
Aleksander Mercik
Verified by Elżbieta Macauley,
Tim Macauley and Ewa Kania
Graphic design: Maciej Szłapka
Argumenta Oeconomica is covered in Thomson Reuters services:
•
Social Sciences Citation Index
•
Social Scisearch
•
Journal Citation Reports/ Social Sciences Edition
and in Elsevier service
•
Scopus
Copyright © 2015 Wrocław University of Economics
300 copies
I. ARTICLES
Beata Łopaciuk-Gonczaryk, Grażyna Bukowska, Jan Fałkowski
TEAMING UP OR WRITING ALONE – AUTORSHIP STRATEGIES IN LEADING
POLISH ECONOMIC JOURNALS……… 5
Agnieszka Wójcik-Mazur, Marek Szajt
DETERMINANTS OF LIQUIDITY RISK IN COMMERCIAL BANKS
IN THE EUROPEAN UNION... 25
Mateusz Machaj
HAYEK’S RETURN TO THE ROOTS?……….…... 49
God’stime Osekhebhen Eigbiremolen, Vivian Ikwuoma Nnetu
NIGERIA’S ECONOMIC GROWTH: DO REMITTANCE INFLOWS REALLY
MATTER?... 67
Monika Raulinajtys-Grzybek, Gertruda Krystyna Świderska
PAYMENT BY RESULTS VS. COSTS OF 24-HOUR STANDBY IN HOSPITALS: EVIDENCE FROM POLAND……….…..…. 85
Anna Sankowska , Dariusz Siudak
THE IMPACT OF ORGANIZATIONAL TRUST ON A FIRM’S MARKET
VALUE.THE EFFECTS OF FIRM SIZE………...………... 105
Karolina Lewandowska-Gwarda, Elżbieta Antczak
ANALYSIS OF INTERNAL EMIGRATION IN POLAND USING THE SPATIAL
DYNAMIC SHIFT-SHARE METHOD………... 123
Joanna Purgał-Popiela
KNOWLEDGE TRANSFER THROUGH INTERNATIONAL ASSIGNMENTS
IN THE ORGANIZATIONAL CONTEXT... 145
Monika Kwiecińska
CORPORATE FOUNDATION’S RELATIONSHIP WITH THE FOUNDING COMPANY AND ITS ROLE IN IMAGE BUILDING AND CORPORATE
COMMUNITY INVOLVEMENT PROGRAMMES………... 169
Maria Wanda Kopertyńska, Krystyna Kmiotek
ENGAGEMENT OF EMPLOYEES OF GENERATION Y – THEORETICAL ISSUES AND RESEARCH EXPERIENCE………... 185
OF A COMPANY... 203
II. REVIEWS AND NOTES
Zdzisław Pisz, Magdalena Rojek-Nowosielska (eds.): SPOŁECZNA
ODPOWIEDZIALNOŚĆ ORGANIZACJI. W POSZUKIWANIU PARADYGMATÓW, METODOLOGII I STRATEGII [SOCIAL RESPONSIBILITY OF ORGANIZATIONS. IN SEARCH FOR PARADIGMS, METHODOLOGY AND STRATEGIES].
(Bożena Klimczak)... 221
Tomasz Słoński, Karolina Żygadło-Daszyńska (eds.):MANAGEMENT OF ENTERPRISES’ FINANCE – THEORY AND PRACTICE
(Krystyna Brzozowska)………..……….. 224
Danuta Strahl, Andrzej Raszkowski, Dariusz Głuszczuk (eds.):GOSPODARKA REGIONALNA W TEORII I PRAKTYCE [REGIONAL ECONOMY IN THEORY
∗
Monika Raulinajtys-Grzybek*, Gertruda Krystyna Świderska*
PAYMENT BY RESULTS VS. COSTS OF 24-HOUR
STANDBY IN HOSPITALS: EVIDENCE FROM POLAND
The purpose of the article was to identify the costs associated with hospital’s standby and to define methodology of calculating and reporting these costs. Standby costs were defined as the costs of the provision of 24-hour access to health care in hospitals. Reimbursing standby costs on the basis of their costs would complement the Payment by Results model. The costing model for calculation of standby costs has been designed and subjected to empirical verification. The constructive approach method was used for this purpose and the verification process took place in 11 hospitals in the area of obstetrics. The obtained results demonstrate the practical applicability of the designed methodology.
Keywords: cost-based pricing, healthcare, costing model, standby costs, Payment by
Results
DOI: 10.15611/aoe.2015.2.05
1. INTRODUCTION
Technological, demographic and other factors cause continuous increase in healthcare expenditure and place emphasis on the reduction of the cost of providing health care services (Walshe, Smith, 2006; Jones, Mellett, 2007). In order to achieve the actual cost reduction it is necessary to obtain information about the unused potential of hospitals. The use of hospital’s resources is economically reflected in its level of costs. The costs may be incurred due to the consumption of resources during the provision of health care services as well as due to the fact that the hospital has continuous access to some resources, regardless of the degree of their current usage. Revenue opportunities depend largely on the ability of linking resources with the services provided and the economic efficiency of their allocation and use (Świderska, 2011). However, to some extent the potential of the hospital suits the emergency health needs of the population.
Acute hospital care means treatment of emergency and elective medical conditions resulting from accidents, injuries or diseases (Hirshon et al., 2013). Hospital serves a specific population, the size of which depends on
the hospital’s type. Most patients are referred by primary care practitioners, but some are admitted from the emergency room. The second case may require immediate provision of necessary treatment (e.g. surgery), diagnosis (e.g. X-ray or CT scan) and hospitalization (e.g. in the intensive care unit) (Benson, 2006). Similar needs may suddenly be reported by inpatients, due to the deterioration of their medical condition.
Inpatient care in most countries has the highest or a very significant share of total spending on health care (WHO). One way of solving this problem was the introduction of the pricing of health services based on the volume of their provision and standardization the pricing units within the system of diagnosis-related groups (DRGs) (Fetter et al., 1976, 1977).
The concept of DRGs allowed to control the cost of health care services and created an incentive to optimize the treatment process (Leister, Stausberg, 2005; Evers et al., 2002). Implementation of the payment related to services provided was one of the aspects of the introduction of market-style incentives in health care (Dixon, 2006; Appleby et al., 2012). The result of these changes, among others, was the increase in the number of elective services, shorter hospital stay and reduction in number of inpatient beds in almost all OECD countries (OECD, 2013).
The emphasis on improving hospital efficiency and reducing costs, however, may have side effects. The hospital will seek to eradicate those areas that do not generate revenues and simultaneously incur high costs. This problem is most relevant in case of for-profit hospital but will also occur in case of public and non-profit hospitals if they are required to balance costs and revenues.
Revenue in the DRGs system appears only when the services are provided. Therefore all areas in which the hospital maintains resources to cover any potential needs of patients are areas that generate losses. These include, for example, 24-hour readiness of the operating theatre, readiness at the intensive care unit, spare inpatient beds in the surgical or orthopaedic ward as well as the uninterrupted readiness of selected diagnostic departments (Freeman, 2007; McConnell, 2007).
Excluding these areas in pricing system of health services results in the omission of the significant aspect of the hospital’s activity – the 24-hour access to certain health services to meet urgent needs of the population. No reimbursement for such activities may result in the providers’ pursuit to limit them, which has a negative impact on the quality and availability of health care.
In Poland, revenue for readiness is paid in emergency departments (Ordinance, 2011; Decree, 2013). Other areas, such as intensive care unit, traumatology centres or specialist surgical departments are paid per results achieved. It is pointed out that the lack of recognition of this issue is one of the reasons for maintaining the unused potential of the hospitals where such units are operating (Stylo, 2014).
The purpose of this article is to identify the costs associated with the provision of 24-hour access to health care in hospitals and to define methodology of calculating and reporting these costs, which would complement the Payment by Results model.
2. STANDBY COSTS AND PAYMENT BY RESULTS – INTERNATIONAL REVIEW
Payment systems for services provided based on the concept of DRGs began to appear in the 1980s. The first solutions were implemented in the United States, Australia, France and England (Wennberg et al., 1984; Crawford, Fottler, 1985; Busse, 2011). This concept quickly gained popularity and now forms the basis of the reimbursement systems in most countries of the European Union, the United States and Australia.
Settlements based on the DRGs are usually the main, but not the only, way of reimbursing hospitals. Total hospital’s revenue can be described using the following formula:
𝑅𝑖 = 𝑅𝐷𝑅𝐺 𝑖+ 𝑅~𝐷𝑅𝐺 𝑖 (1)
where:
Ri – total revenue of the ith hospital,
RDRGi – revenue of the ith hospital allocated on the basis of DRGs
provided,
R~DRGi – revenue of the ith hospital allocated aside the DRG system.
Hospital’s revenue may be settled based on the DRGs provided which corresponds to the Payment by Results approach. In addition, some services can be settled outside the DRG system, e.g. according to global budgets or fee-for-service. Solutions vary among countries. Table 1 shows a summary of the type and coverage of DRG-based payments. The analysis covered those European countries that took part in one of two projects that compared costing and pricing regulations – HealthBasket or EuroDRG. Additionally, the US solutions implemented in Medicare program as well as Australian solutions were included into the review.
Table 1
Type and coverage of DRG-based payments Country % of hospital revenues related to DRGs DRG-based hospital
payment model Range of Payment by Results according to DRG
Australia nearly 100% DRG-based case payments acute inpatient and outpatient care Austria 96% DRG-based budget allocation
Denmark > 20%, varies DRG-based case payments (within global budget) inpatient and outpatient care England 60% DRG-based case payments acute inpatient and outpatient care Estonia 39% DRG-based case payments inpatient and surgical outpatient care Finland varies DRG-based case payments (within global budget) and day care; remaining districts: most hospital districts: inpatient also surgical outpatient care France 80% DRG-based case payments acute inpatient and outpatient care Germany 80% DRG-based case payments (within global budget) acute inpatient care Hungary n/a DRG-based case payments (within global budget) acute inpatient care Ireland 80% DRG-based budget allocation
Italy n/a DRG-based case payments inpatient care Netherlands 84% DRG-based case payments (within global budget) inpatient and outpatient care Poland > 60% DRG-based case payments inpatient and outpatient care Portugal 80% DRG-based case payments and DRG-based budget
allocation
inpatient and surgical outpatient care
Spain
(Catalonia) 20% DRG-based budget allocation
Sweden varies DRG-based case payments (within global budget) inpatient, day- and outpatient care United States
(Medicare) n/a DRG-based case payments inpatient and outpatient care Source: Busse, 2011; Department of Health and Ageing, 2011; Bundesministerium für Gesundheit, Familie und Jugend, 2013; Bilde, Ankjær-Jensen, 2005; O’Reilly et al., 2012; InEk, 2007; Gaál, 2005; Fattore, Torbica, 2005; Oostenbrink, Rutten, 2005; Sveriges Kommuner och Landsting, 2009; CMS, 2010
2.1. Payment by Results
Revenues allocated based on the amount and type of services grouped in DRGs represent approximately 80 per cent of all revenues, although it is worth noting that there are differences between countries (Geissler et al., 2011). In some countries, the level of hospital’s activities is further limited, which is intended to prevent excessive increases in the number of services. The payment model used in Austria, Ireland and Spanish Catalonia differs from the typical Payment by Results approach, as DRGs are used for determining the prospective hospital budget but do not directly affect the level of revenues. In most countries, a functioning system of reimbursement assumes that the revenue depends on the services provided. The method of determining the DRG-based revenue is described by the following formula:
𝑅𝐷𝑅𝐺 𝑖 = 𝛽𝑖� � 𝛼𝑘𝑗𝐷𝑅𝐺𝑗 𝑚 𝑘=1 𝑛 𝑗=1 (2) where:
RDRG i – revenue of the ith hospital allocated on the basis of DRGs
provided,
βi – hospital-specific factor of the ith hospital,
αkj – patient-specific factor for the kth service from the jth DRG,
DRGj – unit price of a service from the jth DRG,
n – number of groups,
m – number of services provided.
The revenue depends on the number and type of provided services, which are grouped into DRGs. Defined specific features of the patients (e.g. children or patients with multiple health problems) the unit price for DRG may be increased. Raising DRG tariffs may also result from the characteristics of the hospital – higher rates may be related to the level of specialization or geographical location (e.g. NHS, 2012-13; Epstein, Mason, 2006).
All countries presented in table 1 use this approach for pricing inpatient care. In some systems – for example, in Australia, England and Germany – the approach to acute and long-term care is distinguished and DRG-based pricing is limited to acute inpatient care. In addition, in most countries the reimbursement on the basis of DRGs is also used in relation to outpatient care.
Standby costs do not fit the model assumptions of Payment by Results. By definition, the payment is set at a level proportionate to the costs incurred
in the optimal course of the service (Waters, Husey, 2004; Feyrer et al., 2005; Schreyögg et al., 2006). Standby costs, however, are the costs of inactivity that should not occur at the optimal course of the service. In the most accurate pricing models tariffs are determined with exclusion of the costs of unused potential – and therefore with exclusion of the standby costs.
2.2. Standby costs in DRG tariff
DRG tariff calculation is usually performed on the basis of information obtained from providers who calculate costs in accordance with the adopted costing model (Negrini et al. 2004; Leister, Stausberg, 2005; Epstein, Mason, 2006). Available costing models offer different levels of precision. The level of precision is determined by two factors. One is the identification of cost components – it can be developed using gross costing or micro costing approach. In gross costing only a very limited number of cost components is identifies whereas in micro costing cost components are identified at a detailed level. The other factor is the valuation of cost components – performed using either top-down or bottom-up approach. The top-down approach calculates the average cost by dividing total costs by total number of cost drivers (e.g. patients). The bottom-up method identifies resources used for each service provided. The combination of the two dimensions creates a four-field matrix (Wordsworth et al., 2005; Tan et al., 2009; Chapko et al., 2009).
The literature is dominated by the belief that the most accurate approach is bottom-up approach micro costing that allocates the costs to individual services in amounts that correspond to their actual absorption of resources (Jackson, 2001; Kaplan, Porter, 2011; Vogl, 2013). The most common alternative is a top-down micro costing, which involves the allocation of all costs into services provided. Table 2 shows the classification of the models used in the analyzed countries.
Bottom-up micro costing approach is used in Australia, Germany and Sweden, where costing guidelines recommend allocating costs at each stage according to the actual amount of resources used in the treatment of a particular patient (Department of Health and Ageing, 2011; InEk, 2007; Sveriges Kommuner och Landsting, 2009).
In these three countries costing takes place at the patient level. Patient collects all the costs incurred during the individual medical treatment. For example, the cost of staff in the hospital ward is assigned in proportion to their actual involvement in care, and in the operating theatre – in proportion to the duration of surgery. Expensive drugs and materials are assigned
Table 2
Methodology of cost accounting of health services to determine the DRG tariff
Country
Methodology of cost accounting of health services
Stages of cost accounting
Italy Portugal United States (Medicare) top-down gross costing
• 1st stage: simplified calculation of the average cost of each category
(e.g. diagnostics or operating theatre)
• 2nd stage: calculation of the average cost of the DRG Austria top-down micro costing + gross
costing
• 1st stage: calculation of the average cost of intermediate products
(e.g. procedures, inpatient days)
• 2nd stage: simplified estimation of the average cost of the DRG England Estonia Hungary Netherlands top-down micro costing
• 1st stage: calculation of the average cost of intermediate products
(e.g. procedures, inpatient days)
• 2nd stage: calculation of the average cost of the DRG Denmark Finland France top-down + bottom-up micro costing
• 1st stage: calculation of the average cost of intermediate products
(e.g. procedures, inpatient days)
• 2nd stage: calculation of the actual patient cost Australia
Germany Sweden
bottom-up micro costing
• 1st stage: calculation of the actual cost of intermediate products for each patient • 2nd stage: calculation of the actual patient cost Source: own work
according to their actual consumption. A similar solution is postulated in Australia in relation to the cost of diagnostic procedures. The German and Swedish models recommend the calculation of the standard cost of medical procedures and assigning it based on the information about the number and type of procedures provided. Some simplification is applied to the cost of basic drugs and materials as well as ward’s infrastructure costs which are allocated on the basis of length of stay.
Precise identification of the resources that are involved in the treatment process results in separation of costs of resources that did not participate in the provision of services. This is the cost of unused resources that will not be included when estimating DRG-based tariffs. Such a separation will not occur in a top-down approach, which involves the allocation of all costs into services provided. Costs calculated using top-down approach will include the cost of unused resources and, therefore, will include the standby costs.
Exclusion of the unused potential in the cost calculation is the direction that has been recognized in the management, because it supports the efficiency improvement and resource management in the organization (Kaplan, Cooper, 1998; Cokins, 2001; Horváth & Partners, 2005). It also enables capturing a causal relationship between the health service and its cost. Indirect recognition of standby costs (and other costs of unused resources) through a top-down approach results in a loss of information about the actual costs of the health service as well as the actual level of standby costs. It is impossible to identify the most efficient providers. There is also no possibility to determine what are the costs of ensuring continuous availability of the specific health services to population served by the hospital.
2.3. Standby costs in additional payments
In addition to payments made in proportion to the amount and type of services performed, in all systems hospitals receive an additional form of reimbursement. Additional payments may arise from the lack of recognition of defined services in the DRG system – for example, in some countries, non-acute inpatient care is settled separately. Additional payments may also be present in certain areas of health care, or in relation to certain categories of costs. The most common categories, which are not included in DRGs tariffs, are education and research (E&R). Additional payments may take the form of a global budget, fee-for-service or per diem and surcharges (see table 3).
In several countries some specialties are excluded from the DRG system. From the point of view of standby costs the most important are separate payments for emergency and intensive care units, which are allocated to hospitals in Finland, France, Germany and Italy. These are examples of units where standby costs typically occur. Exclusion of emergency and intensive care from DRG-based pricing is primarily due to the fact that the costs in these areas are largely associated with constant readiness for providing services in case they are necessary. These areas do not typically treat any elective patients.
Additional payment for these areas are implemented complementarily to the payment for the DRGs. For example, in France those units are provided with additional daily supplements over the DRG tariff (Bellanger et al., 2005; Bellanger, Tardif, 2006). In Germany there is a statutory regulation which entitles the hospital to additional payments when providing certain services is necessary to ensure the safety of the population and simultaneously their quantity is not sufficient to cover the total cost of the resources needed for
Table 3
Revenues allocated aside the DRG system
Country Other payment components Areas excluded from DRG payment Costs not included in DRG tariff
Australia per diem E&R, in case of some providers also capital costs Austria per diem E&R, capital costs and interest Denmark varies E&R, capital costs and interest England additional payments global budget, psychiatric services, community and
ambulance services E&R Estonia fee-for-service, per diem E&R Finland varies intensive and emergency psychiatric services,
care E&R, capital costs and interest France additional payments global budget,
psychiatric services, intensive and emergency
care, rehabilitation, neonatology, dialysis, inpatient radiotherapy
E&R and expensive drugs
Germany additional payments global budget, intensive and emergency care
E&R, expensive drugs, capital costs and interest, allowance for
bad debts, taxes, charges and insurance Hungary payments (including so per diem, additional
called ‘standing fee’) capital costs and interest Ireland additional payments global budget, E&R, expensive drugs Italy additional payments emergency, intensive care and organ
transplantation E&R
Netherlands additional payments global budget, E&R, expensive drugs and commercial exploitation Poland additional payments global budget, intensive and emergency care E&R
Portugal additional payments E&R and expensive drugs Spain
(Catalonia)
global budget, fee-for-service, additional
payments E&R
Sweden varies rehabilitation and burn treatment E&R, expensive drugs and accreditation United States
(Medicare) additional payments E&R
Source: Busse, 2011; Department of Health and Ageing, 2011; Bundesministerium für Gesundheit, Familie und Jugend, 2013; Bilde, Ankjær-Jensen, 2005; O’Reilly et al., 2012; InEk, 2007; Gaál, 2005; Fattore, Torbica, 2005; Oostenbrink, Rutten, 2005; Sveriges Kommuner och Landsting, 2009; CMS, 2010
these services. The occurrence of surcharge and its level depends on the individual negotiations of the public payer with hospitals (KHEntgG §5 Abs. 2).
Interesting approach to the problem can be found in Hungary, where hospitals receive a fixed amount for intensive care, emergency department, traumatology and infectious diseases units. This additional payment is called ‘standing fee’, which indicates the awareness of the occurrence of standby costs in these units (Gaál, 2005; Gaál et al., 2006).
In other countries, readiness of emergency or intensive care is in no way recognized in the pricing process. In addition, none of the analyzed countries distinguished that standby costs may also occur in other units, such as operating theatres or selected diagnostic centres.
Methodology for determining the ‘standby tariff’ for hospital’s readiness is not defined in any of the analyzed costing manuals that focus exclusively on the methodology of DRG tariff calculation (e.g. Department of Health and Ageing, 2011; Bundesministerium für Gesundheit, Familie und Jugend, 2013; NHS, 2012-13; Monitor, 2014; InEk, 2007; Sveriges Kommuner och Landsting, 2009). No research has been published so far on the level of these costs and cost drivers determining it.
3. METHODOLOGY
The results of the study were obtained in a research project using the constructive research approach suggested by Kasanen et al. (1993). This is an empirical and normative approach that entails a theoretical analysis of a new concept whose usability is further empirically tested. Data is typically obtained using a case study method and the aim of the study is both descriptive and analytical as well as problem-solving.
Information on standby costs were obtained in a five-stage process organized within a project ‘Modern management in healthcare institutions – training in cost accounting and management information and tools of restructuring and consolidation of healthcare institutions’ held by the Polish Ministry of Health and the Warsaw School of Economics. The stages of the research were as follows:
a) the costing model for standby costs has been designed within six months of ongoing workshops with 60 healthcare managers,
b) the scope and meaning of standby costs were discussed and addressed during meetings with 1200 healthcare managers which were carried for four years,
c) based on the conclusions of practitioners, the approach to identification and calculation of standby costs was refined,
d) costing model for standby costs was verified in 11 hospitals in the area of obstetrics; the verification process lasted three months,
e) the results were analyzed and generalized for the purpose of recognizing the standby costs in pricing of health services.
The choice of hospitals where the costing model was verified was conducted in a targeted manner. They were selected from the hospitals that have participated in the meetings described in the second stage of the research, which was to ensure the proper preparation of cost information. The sample includes diverse hospitals operating in Poland – both general and specialist, working at local and regional level. The diverse selection of units is intended to illustrate that the problem of standby costs occurs regardless of the nature of the hospital. The analysis took place in the second half of 2013. The analyzed sample is not representative and the results were used to illustrate the methodology of collecting and processing information about standby costs.
4. MODELLING THE STANDBY COSTS – FORMALIZATION OF METHODOLOGY
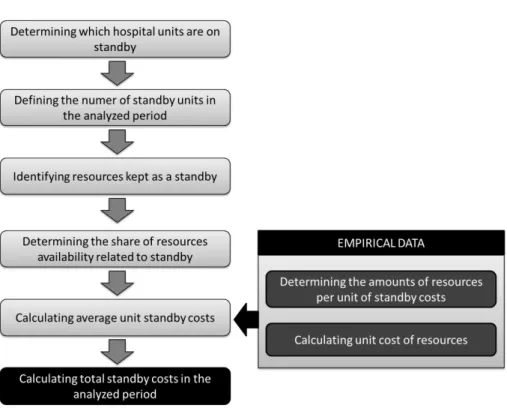
In order to calculate the monthly standby costs it is necessary to implement steps presented in figure 1. Standby costs occur when selected area of the hospital are on duty during the period when services generating DRG-based revenue are not provided. In particular, that means availability at night, during the weekends or on public holidays. This standby has been treated in this model as an activity carried out in various units of hospital. To perform this activity it is necessary to have access to certain human resources, rooms and equipment.
Standby is a special kind of unused potential of the providers. Distinguishing standby costs from other costs of unused potential is an issue that may result in some abuses at the hospital’s level. Uniform approach to the calculation of the standby cost can be achieved when some assumptions are determined centrally by the regulatory institution.
Hospital’s standby costs can be described using the following formula:
𝑆ℎ= � 𝑘𝑖× 𝑈𝐶𝑆𝑖 𝑛
𝑖=1
. (3)
where:
Sh – standby of the hth hospital,
ki – the number of standby units in the ith cost centre,
UCSi – unit standby cost in the ith cost centre,
Figure 1. Methodology of standby cost calculation Source: own work.
The first step is to define the number and types of cost centres which are on standby, always ready to provide services. For each cost centre it is necessary to determine two components – the amount of standby units provided in the analyzed period and the unit standby cost. Unit standby cost is derived from the following formula:
𝑈𝐶𝑆𝑖= � 𝜇𝑖𝑗× 𝑥𝑗× 𝑦𝑗 𝑚
𝑗=1
(4) where:
μj – a ratio that determines what part on the jth resource is associated with
standby,
xj – the number of units of the jth resource maintained at a time of standby,
yj – the unit cost of the jth resource,
The ratio μ determines what part of the resource is associated with standby and what other part is associated with activities that occur at the same time in the cost centre. In units providing medical procedures the resources are usually associated fully with either performing the procedure or kept as a standby – so the ratio is 1. The situation in the hospital ward is more complex. The same resources (e.g. clinicians) are at the same time providing full-time medical care to inpatients and are kept as a standby in case of any emergency.
The designed methodology of standby cost calculation assumes that the empirical data collected from healthcare providers will be used to determine the variables xj and yj. Other variables are given, e.g. provided by the regulatory
institution. Such a limitation in a model reduces the incentives to overestimate the standby costs and reporting other costs of unused potential as standby costs.
Calculation of the unit cost of the resource will be carried out according to the following formula:
𝑦𝑗 =𝑇𝐴𝑇𝐶𝑗
𝑗 (5)
where:
TCj – the total cost of the jth resource,
TAj – the total practical availability of the jth resource.
The total cost of the resource is determined as the sum of all costs associated with the resource. The practical availability of the resource is the maximum availability of the resource that is achievable in practice. Its estimation includes various limiting factors such as sick leaves for employees or maintenance and repair for equipment.
5. THE STRUCTURE OF STANDBY COSTS – RESEARCH EVIDENCE
The analysis included the standby costs in obstetrics. The surveyed hospitals provided information which cost centres are kept as a standby for the purpose of patients in labour. Results are presented in table 4.
All providers pointed to the maternity ward and delivery suite as units which are on standby for obstetrical patients. A larger discrepancy occurred in the case of diagnostic centre. Most hospitals keep laboratory diagnostic imaging as a standby. Some recipients additionally indicated other units such as serology and microbiology. In some cases, diagnostic services are outsourced and the standby cost of these units is included in the unit price of the service and is not specified separately.
Table 4
Standby at the level of cost centres H1
Maternity
ward Delivery suite
Diagnostic Imaging H2 Laboratory, Microbiology H3 Laboratory, Serology
H4 Laboratory
H5 Laboratory, Microbiology, Diagnostic Imaging H6 Laboratory, Diagnostic Imaging
H7 Laboratory, Diagnostic Imaging H8 Laboratory, Diagnostic Imaging H9 Laboratory, Blood Centre H10 Laboratory, Serology
H11 Laboratory, Serology, Transfusion, Diagnostic Imaging Source: own work
The method of calculation of the unit standby cost is presented for delivery suite and maternity ward (table 5). For the purpose of analysis the value of μ ratio was set as 1 for the delivery suite and as 0.1 for the maternity ward. This means that 10% of the resources in a hospital ward is associated with standby, and the remainder with the inpatients.
In addition, it was assumed that the total monthly standby time is 544 hours. This is due to the fact that the medical duty of hospitals in Poland takes place on weekdays between 15.30 and 7.30 (16 hours), on weekends for 24 hours. Between 7.30 and 15.30 on weekdays hospitals should provide elective services. An exemplary month consisting of 16 working days and 8 holidays was taken (16 days times 16 hours plus 8 days times 24 hours equals 544 hours).
The analyzed population of hospitals is relatively small and very diverse. It consists of both local and regional hospitals, both general and specialized ones. Differences in individual hospital’s standby costs are significant and are based on two factors:
• differences in the unit costs of resources,
• differences in the amount of resource units kept as a standby.
These factors partly depend on the geographical location of the hospital, which influences the cost of resources. The amount of resources on standby is a derivative of the size of both the hospital and the population which receives health services. Another important factor is also the efficiency of the hospital. This factor is also significant for the level of DRG-related costs. The presented method of collecting data on standby cost allows the assessment of its actual level and drivers that shape it. Table 6 presents the statistical analysis of the standby cost.
Table 5
Unit standby cost in delivery suite and maternity ward (in PLN)
Name Range/Type of hospital y x μ Delivery suite UCS (per Maternity ward hour) month) S (per x μ UCS (per hour) month) S (per
H1 local / general DR = 4.45 IB = 2.11 M = 30.23 O = 52.41 1 DR 1 M 1 34.68 18,865.92 18 IB 1 O 2 M 0.1 15.08 8,203.52 H2 regional / specialist DR = 1.32 IB = 0.24 M = 35.06 O = 66.42 1 DR 2 M 1 O 1 137.86 74,995.84 62 IB 4 O 1 M 0.1 31.56 17,168.64 H3 local / specialist DR = 10.91 IB = 0.22 M = 27.10 O = 91.70 3 DR 4 M 1 141.13 76,774.72 16 IB 2 O 4 M 0.1 29.53 16,064.32 H4 local / general DR = 0.46 IB = 0.16 M = 35.91 O = 37.94 2 DR 2 M 1 72.74 39,570.56 68 IB 2 O 6 M 0.1 30.22 16,439.68 H5 regional / specialist DR = 0.86 IB = 0.65 M = 38.99 O = 51.83 3 DR 4 M 1 158.54 86,245.76 30 IB 3 O 3 M 0.1 29.20 15,884.80 H6 local / general DR = 1.75 IB = 0.01 M = 25.09 O = 112.95 1 DR 1 M 1 26.84 14,600.96 57 IB 2 O 3 M 0.1 30.17 16,412.48 H7 regional / specialist DR = 4.51 IB = 1.18 M = 37.02 O = 47.77 2 DR 3 O 2 M 1 226.37 123,145.30 44 IB 3 O 3 M 0.1 30.63 16,662.72 H8 local / general DR = 4.31 IB = 1.77 M = 35.37 O = 67.52 1 DR 1 M 1 39.68 21,585.92 30 IB 1 O 3 M 0.1 22.67 12,332.48 H9 local / general DR = 3.01 IB = 0.21 M = 33.07 O = 57.56 1 DR 1 M 1 O 1 93.64 50,940.16 48 IB 1 O 5 M 0.1 23.30 12,675.20 H10 local / general DR = 1.05 IB = 0.09 M = 26.39 O = 49.46 2 DR 3 M 2 O 1 180.19 98,023.36 26 IB 1 O 3 M 0.1 13.10 7,126.40 H11 regional / specialist DR = 7.48 IB = 1.52 M = 34.36 O = 88.66 3 DR 5 M 1 194.24 105,666.60 58 IB 1 O 2 M 0.1 24.55 13,355.20 where: DR – delivery room IB – inpatient bed M – midwife O – obstetrician Source: own work
Table 6
Statistical analysis of the standby cost
Variable Statistical description Wilk test Shapiro- Correlation with UCS (suite) Correlation with UCS (ward) Statistical test; grouping variable Range Statistical test; grouping variable Type UCS (suite) μ = 118.72 m = 137.86 σ = 69.30 W = 0.936 df = 11 p = 0.474 ρ = 1 N = 11 ρ = 0.118 N = 11 p = 0.729 Z = -2.934 p = 0.003 μlocal = 84.13 μregional = 179.25 Z = -2.934 p = 0.003 μgeneral = 74.63 μspecialist = 171.63 UCS (ward) μ = 25.45 m = 29.20 σ = 6.43 W = 0.831 df = 11 p = 0.024 ρ = 0.118 N = 11 p=0.729 ρ = 1 N = 11 U = 6.000 p = 0.164 U = 6.000 p = 0.126 Range W = 0.625 df = 11 p = 0.000 ρ = 0.657 N = 11 p = 0.028 ρ = 0.478 N = 11 p = 0.137 Type W = 0.649 df = 11 p = 0.000 ρ = 0.693 N = 11 p = 0.018 ρ = 0.520 N = 11 p = 0.101
Source: own work
The average standby cost per hour in the delivery suite is 118.72 with a standard deviation of 69.30. The distribution is left-skewed and the median value (m) is 137.86. The variable UCS (ward) that depicts the average standby cost per hour in the maternity ward presents similar distribution with the average of 25.45 (a standard deviation of 6.43) and the median of 29.20.
The analysis was supplemented with statistical tests examining whether the distribution of variables UCS (suite) and UCE (ward) differs depending on the values of variables Range and Type. The standby cost on the delivery suite is positively correlated with both the range of the hospital (either local or regional) and its Type (either general or specialist). The average standby cost of the delivery suite varies between hospitals operating in the local and regional area as well as between general and specialist hospitals. The difference is statistically significant. In case of the standby cost of the maternity ward none of these factors had a significant impact.
SUMMARY
The presented approach enables the calculation of the standby cost of different units in the hospital. It is based both on empirical data and on the top-down regulations established by the institution responsible for the pricing of health services. Imposed regulations are necessary for a clear distinction between the standby costs and other costs of unused potential. The proposed model uses empirical data to obtain the information about the
unit cost of resources and the number of resource units maintained at a time of standby. On this basis it is possible to calculate the unit standby cost in various hospital areas.
Separation of cost and non-financial data allows for numerous analysis. For example at the regional level it is possible to determine whether the total standby maintained by all providers in the region corresponds with the needs of the population. Obtaining data on the standby costs from a representative sample of hospitals provides the basis for the calculation of the standby cost, which may be taken into account when estimating the additional revenue acknowledged for ‘standby’. The presented approach is the extension of cost-based pricing approach above the DRG system into the area of hospital’s standby.
REFERENCES
Appleby, J., Harrison, T., Hawkins, L., Dixon, A., Payment by Results. How Can Payment
Systems Help to Deliver Better Care?. The King’s Fund, 2012.
Bellanger, M., Or, Z., Paris, V., Tardif, L., Approaches for Cost Assessment & Price Setting
in Practice. France, 2005.
http://www.ehma.org/files/WP-6-HealthBASKETSP21-CT-2004-501588_D18_France.pdf. Accessed 26 February 2014.
Bellanger, M., Tardif, L., Accounting and Reimbursement Schemes for Inpatient Care in
France, “Health Care Management Science”, 9(3), pp. 295-305, 2006.
Benson, L., Healthcare Systems: An Overview of Health Service Provision and Service
Delivery [in:] Walshe, K., Smith, J., (eds.) Healthcare Management. Open University
Press, Maidenhead 2006.
Bilde, L., Ankjær-Jensen, A., Approaches for Cost and Price Assessment in the Danish
Health Sector, 2005.
http://www.ehma.org/files/WP-6-HealthBASKETSP21-CT-2004-501588_D17_Denmark.pdf. Accessed 26 February 2014.
Bundesministerium für Gesundheit, Familie und Jugend. Handbuch zur Dokumentation von Kostendaten in landesgesundheitsfondsfinanzierten Krankenanstalten, 2013. http://bmg.gv.at/cms/site2/attachments/9/4/7/CH1241/
CMS1290691839411/handbuch_zur_ dokumentation_von_kostendaten.pdf. Accessed 26 February 2014.
Busse, R., Geissler, A., Quentin, W., Wiley, M. (eds.). Diagnosis-related Groups in Europe:
Moving towards Transparency, Efficiency and Quality in Hospitals. McGraw-Hill/Open
University Press, 2011.
Chapko, M. K., Liu, C., Perkins, M., Li, Y., Fortney, J. C., Maciejewski, M. L., Equivalence
of Two Healthcare Costing Methods: Bottom-up and Top-down, “Health Economics”,
18(10), pp. 1188-1201, 2009.
CMS, The Provider Reimbursement Manual, 2010. http://www.cms.gov/Regulations-and-Guidance/Guidance/ Manuals/Paper-Based-Manuals-Items/CMS021929.html. Accessed 26 February 2014.
Cokins, G., Activity-Based Cost Management: An Executive’s Guide. Wiley, 2001.
Crawford, M., Fottler, M. D., The Impact of Diagnosis Related Groups and Prospective
Pricing Systems on Health Care Management, “Health Care Management Review”,
10(4), pp. 73-84, 1985.
Department of Health and Ageing, Australian Hospital Patient Costing Standards, 2011. http://www.ihpa.gov.au/internet/ihpa/publishing.nsf/Content/Australia-Hospital-Patient-Costing-Standards.htm. Accessed 26 February 2014.
Dixon, J., The Politics of Healthcare and the Health Policy Process: Implications for
Healthcare Management [in:] Walshe, K., Smith, J. (eds.), Healthcare Management.
Open University Press, Maidenhead 2006.
Epstein, D., Mason, A., Costs and Prices for Inpatient Care in England: Mirror Twins or
Distant Cousins?, “Health Care Management Science”, 9(3), pp. 233-42, 2006.
Evers, S., Voss, G., Nieman, F., Ament, A., Groot, T., Lodder, J., Boreas, A., Blaauw, G.,
Predicting the Cost of Hospital Stay for Stroke Patients: The Use of Diagnosis Related Groups, “Health Policy”, 61(1), pp. 23-25, 2002.
Fattore, G., Torbica, A., Approaches for cost/price assessment in practice. Country report:
Italy, 2005. http://www.ehma.org/files/WP_6_HealthBASKETSP21_CT_2004_501588_
D15_Italy.pdf. Accessed 26 February 2014.
Fetter, R. B., Mills, R. E., Riedel, D. C., Thompson, J. D., The Application of Diagnostic
Specific Cost Profiles to Cost and Reimbursement Control in Hospitals, “Journal of
Medical Systems”, 1(2), pp. 137-149, 1977.
Fetter, R. B., Thompson, J. D., Mills, R. E., A System for Cost and Reimbursement Control in
Hospitals, “Yale Journal of Biology and Medicine”, 49(2), pp. 123-136, 1976.
Feyrer, R., Rosch, J., Weyand, M., Kunzmann, U., Cost Unit Accounting Based on a Clinical
Pathway: A Practical Tool for DRG Implementation, “The Thoracic and Cardiovascular
Surgeon”, 53(5), pp. 261-266, 2005.
Freeman, V. A., Walsh, J., Rudolf, M., Slifkin, R. T., Skinner, A. C., Intensive Care in
Critical Access Hospitals, “The Journal of Rural Health”, 23(2), pp. 116-23, 2007.
Gaál, P., Approaches for Cost Assessment & Price Setting in Practice. Hungary, 2005. http://www.ehma.org/ files/WP6%20Hungary.pdf. Accessed 26 February 2014.
Gaál, P., Stefka, N., Nagy, J., Cost Accounting Methodologies in Price Setting of Acute
Inpatient Services in Hungary, “Health Care Management Science”, 9(3), pp. 243-50,
2006.
Geissler, A., Scheller-Kreinsen, D., Busse, R., Germany: Understanding G-DRGs [in:] Busse, R., Geissler, A., Quentin, W., Wiley, M. (eds.). Diagnosis-related Groups in Europe:
Moving towards Transparency, Efficiency and Quality in Hospitals (p. 243-272),
McGraw-Hill/Open University Press, 2011.
Gesetz über die Entgelte für voll- und teilstationäre Krankenhausleistungen, 23. April 2002, BGBl. I S. 1412, 1422.
Hirshon, J. M., Risko, N., Calvello, E., Stewart de Ramirez, S., Narayan, M., Theodosis, C., O’Neill, J., Health Systems and Services: The Role of Acute Care, “Bulletin of the World Health Organization”, 91, pp. 386-399, 2013.
Horváth & Partners, Prozessmanagement umsetzen. Durch nachhaltige Prozessperformance
InEk, Kalkulation von Fallkosten. Handbuch zur Anwendung in Krankenhäusern, 2007. http://www.aok-gesundheitspartner.de/imperia/md/gpp/bund/krankenhaus/drg_system/ drg_entwicklung/kh_drg_kalkulationshandbuch_070918.pdf. Accessed 26 February 2014. Jackson, T., Using Computerised Patient-level Costing Data for Setting DRG Weights: The
Victorian (Australia) Cost Weight Studies, “Health Policy”, 56(2), pp. 149-163, 2001.
Jones, M. J., Mellett, H. J., Determinants of Changes in Accounting Practices: Accounting
and the UK Health Service, “Critical Perspectives on Accounting”, 18(1), pp. 91-121,
2007.
Kaplan, R. S., Cooper, R., Cost & Effect: Using Integrated Cost Systems to Drive Profitability
and Performance, “Harvard Business Press”, 1998.
Kaplan, R. S., Porter, M. E., How to Solve the Cost Crisis in Health Care, “Harvard Business Review”, 89(9), pp. 47-64, 2011.
Kasanen, E., Lukka, K., Siitonen, A., The Constructive Approach in Management Accounting
Research, “Journal of Management Accounting Research”, 5, pp. 243-264, 1993.
Leister, J. E., Stausberg, J., Comparison of Cost Accounting Methods from Different DRG
Systems and Their Effect on Health Care Quality, “Health Policy”, 74(1), pp. 46-55,
2005.
McConnell, K. J., Gray, D., Lindrooth, R. C., The Financing of Hospital-Based Emergency
Departments, “Journal of Health Care Finance”, 33(4), 31-52, 2007.
Monitor, Approved costing guidance. Updated February 2014. http://www.monitor.gov.uk/ sites/default/files/ publications/ApprovedCostingGuidanceFeb2014.pdf. Accessed 26 February 2014.
Negrini, D., Kettle, A., Sheppard, L., Mills, G. H., Edbrooke, D. L., The Cost of a Hospital
Ward in Europe: Is There a Methodology Available to Accurately Measure the Costs?,
“Journal of Health Organization and Management”, 18 (2-3), pp. 195-206, 2004.
NHS, Reference costs guidance for 2012-13. https://www.gov.uk/government/uploads/ system/uploads/attach-ment_data/file/213206/Draft-reference-costs-guidance-for-2012-13-not-accessible.pdf. Accessed 26 February 2014.
Ordinance, Rozporządzenie Ministra Zdrowia z dnia 3 listopada 2011 r. w sprawie szpitalnego oddziału ratunkowego, Dz.U. 2011, Nr 237, poz. 1420, with later changes. Ordinance, Zarządzenie Nr 89/2013/DSOZ Prezesa Narodowego Funduszu Zdrowia z dnia 19
grudnia 2013 r. w sprawie określenia warunków zawierania i realizacji umów w rodzaju: leczenie szpitalne, with later changes.
O’Reilly, J., Busse, R., Häkkinen, U., Or, Z., Street, A., Wiley, M., Paying for Hospital Care:
The Experience with Implementing Activity-based Funding in Five European Countries,
“Health Economics”, Policy and Law, 7(1), pp. 73-101, 2012.
OECD, Health at a Glance 2013: OECD Indicators, OECD Publishing, 2013
Oostenbrink, J. B., Rutten, F. F. H., Cost Assessment and Price Setting of Inpatient Care in
the Netherlands. The DBC Case-mix System, “Health Care Management Science”, 9(3),
pp. 287-94, 2006.
Schreyögg, J., Stargardt, T., Tiemann, O., Busse, R., Methods to Determine Reimbursement
Rates for Diagnosis Related Groups (DRG): A Comparison of Nine European Countries,
Sveriges Kommuner och Landsting, Nationella KPP-principer, version 2, Kostnad per patient, 2009. http://webbutik.skl.se/sv/artiklar/nationella-kpp-principer-version-2-kostnad-per-patient.html. Accessed 26 February 2014.
Stylo, W., Centrum urazowe – przyczyna niewykorzystanego potencjału w szpitalu [Trauma
Centre – The Reason for Unused Potential in a Hospital] [in:] Świderska, G. K. (ed.), Koszty w opiece zdrowotnej [Cost in Health Care]. Oficyna Wydawnicza SGH,
Warszawa 2014.
Świderska, G. K. (ed.), Rachunek kosztów w Zakładzie Opieki Zdrowotnej [Cost Account in
Health Care Centre]. Oficyna Wydawnicza SGH, Warszawa 2011.
Tan, S. S., Rutten, F. F. H., van Ineveld, B. M., Redekop, W. K., Hakkaart-van Roijen, L.,
Comparing Methodologies for the Cost Estimation of Hospital Services, “The European
Journal of Health Economics”, 10(1), pp. 39-45, 2009.
Vogl, M., Improving Patient-level Costing in the English and the German ‘DRG’ System, “Health Policy”, 109(3), pp. 290-300, 2013.
Walshe, K., Smith, J. (eds.), Healthcare Management. Open University Press, Maidenhead 2006.
Waters, H. R., Hussey, P., Pricing Health Services for Purchasers – A Review of Methods and
Experiences, “Health Policy”, 70(2), pp. 175-184, 2004.
Wennberg, J. E., McPherson, K., Caper, P., Will Payment Based on Diagnosis-related Groups
Control Hospital Costs?, “The New England Journal of Medicine”, 311(5), pp. 295-300,
1984.
Wordsworth, S., Ludbrook, A., Caskey, F., Macleod, A., Collecting Unit Cost Data in
Multicentre Studies. Creating Comparable Methods, “The European Journal of Health
Economics”, 6(1), pp. 38-44, 2005.