TRENDS
in
Sport Sciences
2014; 3(21): 135-144. ISSN 2299-9590
In the last years, sports scientists have increasingly considered teams to be complex, dynamical systems and have started to capture their team dynamics based on tracked positional data. However, few studies have focused on the influence of specific performance constraints such as the defense playing method in the team dispersion behaviors. The aim of this exploratory study was to analyze the influence of changing the defense playing method from zone defense to man-to-man defense, in the team dispersion behaviors during small-sided soccer games. We analyzed two small-sided games played by two teams of 6 players (5 outfield players plus a goalkeeper). In the first experimental condition both teams used zone defense, and in the second condition they changed to man-to-man defense. Team dispersion behaviors were captured by four compound variables found in literature – surface area, stretch index, length per with ratio (lpwratio) and teams’ centers distance. Results suggested that the defensive playing method influences team dispersion behaviors. Compared to man-to-man defense, using zone defense teams showed low values of surface area (326 ± 139 m2 vs. 360 ± 172 m2 for Team 1
and 195 ± 111 m2 vs. 265 ± 133 m2 for Team 2) and length per with
ratio (0.70 ± 0.20 vs. 0.80 ± 0.42 for Team 1 and 0.47 ± 0.21 vs. 0.58 ± 0.24 for Team 2). Contrariwise, zone defense implied high values of distance between the geometrical centers (8.6 ± 2.3 m vs. 5.4 ± 1.6 m), when compared to man-to-man defense, respectively. Stretch index values were not similar for the two teams as Team 1 showed high values for zone defense (15.7 ± 2.8 m vs. 15.2 ± 3.0 m), and Team 2 showed low values for zone defense (10.9 ± 2.8 m vs. 11.6 ± 2.6 m). These findings, although at an exploratory level, suggest that teams adopting zone defense tend to be more compacted, especially in the wide direction of the field. Moreover, zone defense also implied a more structured spatial behavior with teams enlarging the distance between each other.
KEYWORDS: defense playing method, soccer, small-sided soccer games.
Received: 15 July 2014 Accepted: 28 August 2014
Corresponding author: rduarte@fmh.ulisboa.pt
Universidade de Lisboa, Faculdade de Motricidade Humana, Lisbon, Portugal
What is already known on this topic?
The behavior of sports teams, viewed as complex dynamical systems, have been investigated in the last years using tracked positional data. For that, some group-motion positional variables were used to capture and describe specific team dispersion behaviors such as the covered areas, the stretching of teams, their length and width. However, to the best of our knowledge, there is no data on the influence of changing key performance constraints such as the defensive playing method (i.e. man-to-man or zone defense) adopted by teams during small-sided games practice.
Introduction
I
n the last years, research in sports performance has been considering team sports as complex, dynamical systems instead of breaking the system into smaller and simpler parts and study them in an isolated manner [1, 2]. One of the main features of sport teams considered as complex systems is their capacity to spontaneously change from one state to another (i.e. self-organization) when system stability experiencesMan-to-man or zone defense? Measuring team dispersion
behaviors in small-sided soccer games
perturbations, even small ones, caused by internal or external system constraints [3]. This approach focuses on the interactions developed between players from both teams in relation to the surrounding performance environment where the game is played [4, 5]. Thus, the behavior of a complex system should be captured by ecological variables or context-based measures [6, 7]. Previous investigations on sports as complex, dynamical systems proposed players’ dyads as the basis for the identification of space-time patterns of coordination [3]. Those dyads could be intra-coupling dyads, i.e. interactions between two players from the same team, or inter-coupling dyads, i.e. interactions between two players from opposing teams [8]. There are some examples of dynamic systems based investigations analyzing competing dyads on sports such as squash [9, 10, 11], tennis [12, 13], boxing [14] as well as on team sports such as basketball [15], rugby union [5, 16] or soccer [2, 7].
Beyond the referred studies focused on competing dyads, others have been analyzing group-level behaviors using the same underlying principles of complex, dynamical systems. This approach can be justified by, and consistent with, the principle of universality for complex systems, which states that a complex system will subscribe to similar descriptions on different levels of analysis and timescales [17, 18]. Therefore, group-level behaviors in team sports can follow similar research strategies as the employed in the study of dyadic relations at the level of individuals. However, it needs to find ecological group-motion variables suitable to synthesize the meaningful interactions among teammates during performance [19]. Following this suggestion, Frencken et al. [20, 21], investigated the team behavior of two sub-groups of soccer players during small-sided games using the surface area and centroid positions as group-motion variables. Those investigations focused on describing group-level interactions emerging during the game, particularly during sequences of play leading to goal-scoring opportunities. The authors suggested that the team centers can capture ‘pressure’, in the way the shorter the distance between the two centers, the higher the pressure. High ‘pressure’ here means that the team without the ball has the initiative to seek the possession and perturb the team with the ball conceding less space to the team with ball possession. This pressure concept is easily understood however it is not quite acceptable that the distance between the team centers might express the notion of ‘pressure’. Many exemplar situations can
be offered in which the distance between the centers is small and the pressure is low – a situation with the team without the ball wide open (e.g. occupying a large area of the pitch) and the geometric center very close to the center of the opposing team will never represent a situation of collective pressure as the team with the possession has plenty of space to play. Frencken et al. also concluded that the team center distance, as a single variable, does not capture the collective ‘pressure’ because players can either be very close or far way off the team’s center. For these reasons, we considered this variable captured the closeness of the teams’ centers. In the same research program, the surface area is considered an accurate descriptor of ball possession since the authors state that the attacking team has a larger surface area when compared with the defending team. These investigations showed a correlation for teams’ centroid positions, describing the natural rhythmic flow of attacking and defending phases. The counterphase relation expected for the surface area was not clearly observed and investigators justified that with the small number of players involved in the experiment.
Trying to prove the previously cited ‘principle of universality for complex systems’, Bourbousson et al. [15, 17] had conducted a two-part investigation on basketball game behaviors. In the first part the authors analyzed player-player interactions: intra-coupling dyads (pairs of players from the same team) and inter-coupling dyads (pairs of players from opposing teams). They reported phase and anti-phase relations between dyads considering both longitudinal and lateral displacements. In the second part of the investigation, the authors analyzed game behaviors at a higher level of complexity, moving to a team-team analysis. For that purpose, they used two group-level variables that were expected to capture the team dispersion behaviors. The ‘spatial center’ (previously referred as geometrical or teams’ center) was used to capture the average team positioning on the court and the ‘stretch index’ was used to capture team players’ dispersion around the spatial center. According to the authors, the stretch index measures the expansion or contraction of space in the longitudinal and lateral directions of a team during the game and was calculated by computing the mean of the distances between each player and the spatial center of that team. The stretch index represents the mean deviation of each player in a team from the spatial center. Data showed a predominant in-phase relation in both lateral and longitudinal directions (with more
attraction in the longitudinal collective displacements) for the spatial center analysis and also an in-phase relation of the stretch index for the lateral direction. For the relative stretch index, i.e. difference between stretch indexes of the two teams at any given instant, data revealed phase transitions between two states. The authors concluded that these data were explained by the reciprocity between teams in their amounts of expansion and contraction when possession of the ball is won and lost. As expected, this study was consistent with the universality of complex system principles as it showed similar patterns of behavior when analyzing the game at a dyadic and team level.
Following the same line of investigation, Folgado et al. [22] used small-sided games to examine team behaviors in youth soccer (U9, U11 and U13 age levels). This study was based on the use of two collective variables: an intra-team variable, length per width ratio (lpwratio), and an inter-team variable, the distance between the geometrical centers of the teams. Results showed that collective behaviors of teams varied according to the players’ age, with younger teams presenting higher length per width relation in their positioning on the pitch and a reduced distance between team centers. These findings were interpreted as an indicator of better collective tactical behavior of older players associated with high tactical expertise.
From the studies reviewed it is clear that only the one conducted by Folgado et al. [22] treated the game as a continuum. Frencken et al. [20, 21] and Bourbousson [15, 17] et al. opted to gather a set of game sequences to examine the collective behavior of teams during the game. In those cases the collective behaviors were analyzed and associated with the emergence of critical incidents in the game (a goal-scoring opportunity or a basket). This kind of approach does not consider all match events in a continuum, and the entire time-evolving dynamics of the game is something forgotten in those studies. This may lead to some limitations when intending to generalize data to understand the natural variations across the entire games. Moreover, to the best of our knowledge no studies on group-level interactions in sport teams assessed the influence of changing relevant performance constraints in team dispersion behaviors. In this respect, a relevant performance constraint on team performance is the defensive playing method adopted by teams (i.e. man-to-man or zone defense [4, 23]). For example, Kim [23] hypothesized that using zone defense a team would have smaller occupied areas
(calculated using Voronoi diagrams) than when using man-to-man defense, which should demonstrate higher variations. However, there is no experimental data proving these assertions.
The purpose of this exploratory study was to analyze the influence of changing between zone defense and man-to-man defense on team dispersion behaviors during small-sided soccer games.
Methods
Participants
Twelve youth football players, aged between 15 and 17 years old (16.2 ± 0.6), with body height of 175.3 ± 4.7 cm and body mass of 67.0 ± 3.5 kg participated in this study. The players were selected from an under-17 team of a Portuguese top club, with about 6 years of football practice at a competitive level (5.6 ± 1.5 years). The club coach was asked to select the players based on the criterion of balanced teams, and to assign each player to its common field position. Participants were distributed between two teams of five outfield players and a goalkeeper, and played the games according to the regular association football rules. The goalkeepers were not monitored during the games, but were included in the study in order to maintain the representativeness of the ecological performance constraints. All the participants voluntarily agreed to participate in the study and signed their written consent.
Experimental conditions
The proper use of the defensive method during the experiment was guaranteed by the team’s coach instructions. In the first game both teams used zone defense and the coach explained that players should behave, without ball possession, the same way they behave normally, because zone defense had been the method adopted by the team since at least the beginning of the season. The ball and the team mates were the players’ reference as soon as the team lost ball possession. In the second game both teams were compelled to use man-to-man defense, and before the game started the team’s coach had a conversation with the players and formed dyads (i.e., pairs of opposing players) that should work as references for individual marking (i.e., as soon as the team lost ball possession its players should mark the attributed opposite). The team’s coach was constantly giving feedback to both teams to assure that the principles of each defensive method were accomplished.
Each team was instructed to perform in a diamond shape formation with one central defender, three midfields and one central forward as it was usually in this team’s practice sessions. The players were chosen by their field positions and assigned to a team randomly.
Field procedures
The two teams played two games of 10 minutes each with an eight-minute passive break between games to ensure that fatigue did not influence the results, on 40 x 42 m pitch To guarantee a sufficient rest time between the games, we monitored the heart rate of all players during the experiment. Minimum values of players’ heart rate observed during the rest period were 104 ± 11 bpm. The games were played after a warm-up period of 10 minutes, consisting of general mobilization exercises involving lower and upper limb movements and short distance runs.
Players’ positional data (x, y coordinates) were captured using a Global Positioning System (GPSports SPI Elite system, GPSports, Canberra, Australia) with a sampling rate of 15 Hz. The system was composed by 10 GPS devices (one per each outfield player) that were firmly attached to a custom-made vest secured to the participant’s upper back (level of the scapula) according to manufacturer’s specifications.
All devices were previously calibrated to avoid satellite connection problems, as suggested by the manufacturer, and were placed on individuals’ backs just before the start of the warm-up, so the players were familiarized with the devices. After the training session, positional data were transferred to Excel files using Team AMS R2 2010 software (GPSports, Canberra, Australia) that connects to each of GPS devices to download the players’ coordinates (see Figure 1). Each game resulted in 9000 data points for each player in the x- and
y-component of motion.
The validity and reliability of this GPS system were verified in literature [24, 25]. Gray et al. [25] found measurement errors (maximum error was 9.8% in a sprint trial on a non-linear path) to capture the positioning, speed and distances covered by team players, showing that GPS devices were suitable in most conditions for the measurement of movement displacement trajectories in field-based team sports. The mentioned studies used 1 Hz GPS devices. However, we used 15 Hz GPS devices in our study, which we consider to enhance the measurement accuracy and smooth the inherent errors.
Variables computations
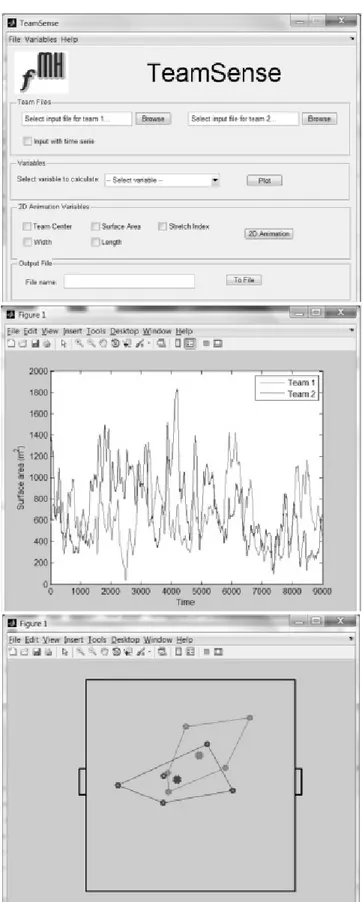
In order to assess the collective behavior of the teams, we created a Matlab Application – TeamSense to calculate relevant group-motion variables at the level of the team. This software application (Figure 2a) uses individuals’ raw positional data as input files and returns the group-level variables as outputs presented in time-plots (Figure 2b) and 2D video stream (Figure 2c). TeamSense was used to calculate all the variables utilized in the current study. The group-motion variables included the surface area, stretch index, length per width ratio and distance between teams’ centers.
Surface area was calculated using a Matlab function
(convhull) that creates a convex polygon from a given number of points (in this case we used a maximum
Figure 1. Team AMS software application: a) Download
module view, where device data is gathered; b) Analysis module view, where each player information was displayed and exported to .txt files
number of 5 points corresponding to the 5 outfield players of each team), and returns the sorted points that constitute the polygon and the polygonal surface area for each time frame [20, 21]. This variable expresses the relation between the covered spaces of both teams and how they behave over the playing time.
The stretch index was calculated using the mean distance from each player’s position to the geometrical center of the corresponding team center [26]. This variable expresses the dispersion of all team players around its geometrical center.
The length per width ratio (lpwratio) was calculated for each team as the ratio between length and width (lpwratio = length/width). Length and width were obtained as the difference between the maximum and minimum values from the y-axis and the x-axis of motion, respectively [22]. Lpwratio captures the shape through the relation between the length and the width of the team (i.e., longer and thinner teams have higher
lpwratio values than shorter and larger teams).
The distance between teams’ centers was calculated as the distance between the geometrical centers of both teams. The geometrical center of each team was calculated using the average positions (x and y) of the players in each time frame [20, 21, 22]. This variable was used as an indicator of teams’ closeness during the game.
Data Analysis
Due to the exploratory purpose of the current study, the variations of the three group-motion variables characterizing team dispersion behaviors of each team, i.e. surface area, stretch index and length per width ratio were analyzed using box-and-whisker plots with means and standard deviation. The same procedure was utilized for the inter-team variable distance between teams’ centers. Results
Box-and-whisker plots with mean and standard devi-ation data are presented according to the dependent variables.
Surface area
The mean data of surface area revealed that both teams presented large covered areas using man-to-man defense: 360 ± 172 m2 for Team 1, and 265 ± 133 m2 for
Team 2; and in the case of zone defense: 326 ± 139 m2
and 195 ± 111 m2, respectively (Figure 3).
Analyses also showed high variability (SD) for man-to-man defense when compared to zone defense.
Figure 2. TeamSense software application developed in
Matlab: a) TeamSense entry point view; b) Example of a time-plot variable output (e.g. surface area); c) Exemplar photogram from a variable 2D video animation (e.g. surface area)
Stretch index
For the stretch index, mean data varied differently for the two teams. The first team achieved higher values in zone defense (15.7 ± 2.8 m) than in man-to-man defense (15.2 ± 3.0 m). Contrariwise, the second team obtained lower values in zone defense (10.9 ± 2.8 m) compared to man-to-man defense (11.6 ± 2.6 m) (Figure 4).
Figure 4. Mean and standard deviation values of stretch index
per team, according to the defensive playing method
Length per width ratio
The lpwratio data revealed higher mean values in man-to-man defense for Team 1 (0.80 ± 0.42) and Team 2 (0.58 ± 0.24), than in zone defense: 0.70 ± 0.20 and 0.47 ± 0.21, respectively. Both teams showed the same trend in this variable (Figure 5).
The analyses also showed high variability (SD) for man-to-man defense when compared to zone defense in both teams (Figure 5).
Figure 5. Mean and standard deviation values of lpwratio per
team, according to the defensive playing method
Teams’ centers distance
For the teams’ centers distance, data showed higher mean values in zone defense (8.6 ± 2.3 m) than in man-to-man defense (5.4 ± 1.6 m) (Figure 6).
Figure 6. Mean and standard deviation values of the teams’
centers distances according to the defensive playing method Standard deviation values also showed that there was high variability in zone defense condition than in man-to-man defense.
Discussion
The purpose of this preliminary investigation was to identify how the team dispersion behaviors may be influenced by changes in the defensive playing method. The team behaviors were measured with the use of four group-motion variables suggested in literature: surface area, stretch index, length per width ratio and teams’ centers distance; and the defensive playing method (zone vs. man-to-man) was implemented in two small-sided games conditions.
Figure 3. Mean and standard deviation values of surface area
per team, according to the defensive playing method
Length/W
idth ratio
team 1 team 2
team 1 team 2
Method 1 (Zonal) Method 2 (Man-to-man)
team 1 team 2 Method 1 (Zonal) Method 2 (Man-to-man) Method 1 (Zonal) Method 2 (Man-to-man) Method 1 (Zonal) Method 2 (Man-to-man) Surface Area (m 2) 1000 800 600 400 200 0 25 20 15 10 5 0 Stretch Index (m) 20 15 10 5 0 Teams’ Centers Distance (m) 2,00 1,75 1,50 1,25 1,00 0,75 0,50 0,25 0,00
Generally speaking, the present study showed that changes in the defensive playing method tend to influence team dispersion behaviors during small-sided soccer games.
Regarding the surface area measure, data demonstrated an increase in the covered areas when teams used man-to-man defense compared to zone defense. This can be explained by the fact that when teams played using man-to-man defense, players follow their direct opponent’s displacements closer in the field. As the attacking team usually covers more space to find appropriate conditions to circulate the ball [17], the defending team was more dispersed in the field when using man-to-man defense. In a former investigation, Frencken et al. [21] tried to prove that there was a negative correlation between surface area for the two competing teams, arguing that the team in ball possession should enlarge its covered area and, simultaneously, the team without ball possession should shorten its covered area. That relation was not confirmed (i.e., correlation values around 0) and the authors pointed to experimental constraints such as the reduced number of players or the available space to play (due to the use of small-sided games). However, our results suggested that Frencken et al. [21] assumptions could be correct because the superior values of surface area in man-to-man defense may be caused by the enlargement of the area covered by the attacking team and the responsiveness of defending players in this type of defensive behaviors. In the current study, the standard deviation values of surface area also identified high variability for teams using man-to-man defense when compared to zone defense. This may suggest that using zone defense teams remain more stable in the amount of covered area, less willing to lose spatial organization because team shape is more stable, and more economic (physically and psychologically) once players experience fewer changes/variations when defending.
The same pattern was not found in stretch index measures because the two teams presented a different trend when the defensive playing method was manipulated with. The results revealed a high stretch index for man-to-man defense in Team 2, but not in Team 1 (stretch index is slightly higher for zone defense than for man-to-man defense). Bourbousson et al. [17] observed that basketball teams using man-to-man defense demonstrated lower stretch index values for the defending team and higher for the attacking team. However, considering zone defense as a more compact spatial organization, with players
closer to each other (i.e., low interpersonal distances between teammates) to decrease the available space for attackers, the stretch index results did not completely correspond to that expectation, at least for one of the teams. Our expectations were that the stretch index should be similar to the surface area results (also a team dispersion measure) but, interestingly, data showed that the two measures captured different peculiarities of the contraction/expansion behaviors of teams. These unexpected and different patterns observed between teams may be explained by the specific interaction tendencies of players from each team.
In a study of young soccer players, Folgado et al. [22] found a decrease in lpwratio for the teams with more experienced players (i.e., with more years of practice). This decrease was linked to the evolution of the team tactical behaviors, meaning that experienced teams tended to have more similar values of width and length, while the younger players tended to develop game patterns with more length than width (i.e., players use predominantly the length dimension of the pitch). Our results demonstrated that teams had more width than depth in the two experimental conditions (values of lpwratio less than 1). This can be due to the pitch size as it was almost squared in terms of dimensions (width size slightly bigger than length) as suggested in literature [27]. However, teams using zone defense demonstrated low values of lpwratio when compared to man-to-man defense. This may suggest that, according to Folgado et al. [22], in zone defense we can assist to an emergence of more evolved team tactical behaviors with a more balanced occupation of the field space once teams presented similar values of width and length. Standard deviation data also suggested that teams using man-to-man defense tended to be less stable under this pattern. The high variability for this experimental condition (i.e., man-to-man defense) may be influenced by a greater instability of the defensive structure and by the continuous changes in the team shape (in depth and width) caused by the individual focus of the defending players, who have to follow the opponents and mark them individually in the entire pitch.
Complimentary information on team behavior is the closeness between teams’ centers. Frencken and Lemmink [20], Frencken et al. [21] and Bourbousson et al. [17] agree that there is a trend for an in-phase relationship between the centers of opposing teams. This relationship is considered to be an expression of the natural rhythmic flow of attacking and defending
during competition. However, none of these studies considered the influence of specific performance constraints such as the manipulated defensive playing method in teams’ centers proximity. Although opposing teams’ centers tend to move synchronously during attacking and defending phases, our data showed the distance between teams’ centers were influenced by the defensive playing method adopted by teams. Thus, these distances were longer for zone defense compared with man-to-man defense. Probably, the constraints imposed in man-to-man marking forced defending players to follow their opposites individually on the pitch, so the defending team positioning would be similar to attacking team positioning, and their geometrical centers would be closer. Contrariwise, in the zone defense the defending players’ positioning would function collectively as a compact block between the ball and the goal, wherever the attacking team is positioned. So, their geometrical centers would be further apart. In the same way, Folgado et al. [22] concluded the younger and less experienced team players showed lower geometrical centers distances when compared to older and more experienced players. The authors proposed the youngest players tend to solve game tasks using individual-based performance rather than a collective-based work based on a balanced spatial distribution and coherent/coordinated behaviors of players. Analysis of the variability of teams’ centers distance can also reinforce our thoughts. Standard deviation data showed that for zone defense there was higher variability than for man-to-man defense. As we stated before, the features of each defensive method can explain this. If the teams open and close the spaces according to exchanges in ball possession [17, 20, 21], it is expectable that they would reveal a higher variability of their teams’ centers distances when compared with teams that follow their opponent players along the entire pitch, in which the geometrical center of each team remains close to the center of the other team.
Conclusions
Changing the defensive playing method adopted by teams during small-sided soccer games seemed to have an influence on the team dispersion behaviors. In this investigation we found that, compared to man-to-man, zone defense elicited lower and less variable covered areas, with a more proportional occupation of the field space (in terms of length and width), and with a more
structured field space for each team, once team center’s distances were higher. These findings can be explained by the task constraints imposed in man-to-man defense that forced defending players to follow their direct opponents individually on the pitch, so the defending team positioning would be similar to the attacking team positioning. As the attacking team usually covers more space to find appropriate conditions to circulate the ball, in the man-to-man defense the defending team also tended also to occupy larger areas and to have their team centers very close. Contrariwise, in the zone defense the defending players’ positioning would function collectively as a compact block dynamically covering the risky areas of the field (usually between the ball and the goal), wherever the attacking team is positioned.
The current study analyzed two teams of six players each (goalkeeper plus five outfield players) and we assume that there can be some differences considering the 11-a-side game format, with a high number of inter- and intra-coupling relations and increased complexity. The playing field (42 x 40 m) was not proportional to a normal football field size because we opted to maintain the field dimensions typically used by the selected teams, however these dimensions corresponded to the length/width proportion suggested in literature [27]. In terms of future research, we hypothesize that using different shapes and sizes of the field diverse team dispersion behaviors can emerge as players collectively adapt themselves to the environmental and task constraints.
What this paper adds?
To the best of our knowledge, this is the first report focusing on understanding the influence of using man-to-man and zone defense during soccer practice. At an exploratory level the results of this investigation suggest that varying the defensive playing method does influence the team dispersion behaviors during small-sided soccer games. Overall, the use of zone defense constrained players to produce more compacted and stable herding behaviors, allowing teams to function as a collective dynamically covering the risky areas of the field, independently of the attacking team players. On the other hand, man-to-man defense deviate player’s attention to perform individually and intentionally pursue his/ her direct opponent in the field, independently of the intended team shape.
References
1. Davids K, Araújo D, Shuttleworth R. Applications of dynamical systems theory to football. In: Reilly T, Cabri J, Araújo D, eds., Science and Football V, 537-550. London: Routledge, Taylor & Francis, 2005.
2. Duarte R, Araújo D, Gazimba V, Fernandes O, Folgado H, Marmeleira J, Davids K. The ecological dynamics of 1v1 sub-phases in association football. The Open Sports Sciences Journal, 2010; 3, 16-18.
3. McGarry T, Anderson D, Wallace S, Hughes M, Franks I. Sport competition as a dynamical self-organizing system. Journal of Sports Sciences, 2002; 15, 171-181. 4. McGarry T. Applied and theoretical perspectives of
performance analysis in sport: Scientific issues and challenges. International Journal of Performance Analysis in Sport, 2009; 9, 128-140.
5. Passos P, Araujo D, Davids K, Gouveia L, Serpa S, Milho J, et al. Interpersonal pattern dynamics and adaptive behavior in multiagent neurobiological systems: Conceptual model and data. Journal of Motor Behavior, 2009; 41(5), 445-459.
6. Araújo D, Davids K, Hristovski R. The ecological dynamics of decision making in sport. Psychology of Sport and Exercise, 2006; 7, 653-676.
7. Duarte R, Araújo D, Fernandes O, Fonseca C, Correia V, Gazimba V, et al. Capturing complex human behaviors in representative sports contexts with a single camera. Medicina (Kaunas), 2010; 46(6), 408-414.
8. Travassos B, Araújo D, Correia V, Esteves P. Eco-Dynamics Approach to the study of Team Sports Performance. The Open Sports Sciences Journal, 2010; 3, 56-57.
9. McGarry T, Khan MA, Franks IM. On the presence and absence of behavioural traits in sport: an example from championship squash match-play. Journal of Sports Sciences, 1999; 17, 297-311.
10. McGarry T. Identifying patterns in squash contests using dynamical analysis and human perception. International Journal of Performance Analysis in Sport, 2006; 6, 134-147. 11. McGarry T, Walter F. On the detection of space-time patterns in squash using dynamical analysis. International Journal of Computer Science in Sport, 2007; 6, 42-49.
12. Palut Y, Zanone P-G. A dynamical analysis of tennis: Concepts and data. Journal of Sports Sciences, 2005; 23, 1021-1032.
13. Lames M. Modeling the interaction in game sports – relative phase and moving correlations. Journal of Sports Science and Medicine, 2006; 5, 556-560. 14. Hristovski R, Davids K, Araújo D.
Affordance-controlled bifurcations of action patterns in martial arts.
Nonlinear Dynamics, Psychology and Life Sciences, 2006; 10, 409-449.
15. Bourbousson J, Sève C, McGarry T. Space-time coordination dynamics in basketball: Part 1. Intra- and inter-couplings among player dyads. Journal of Sports Sciences, 2010a; 28, 339-347.
16. Passos P, Araújo D, Davids K, Gouveia L, Milho J, Serpa S. Information governing dynamics of attacker-defender interactions in youth rugby union. Journal of Sports Sciences, 2008; 26(13), 1421-1429.
17. Bourbousson J, Sève C, McGarry T. Space-time coordination dynamics in basketball: Part 2. The interaction between the two teams. Journal of Sports Sciences, 2010b; 28, 349-358.
18. Sumpter DJ. The principles of collective animal behaviour. Philosophical Transactions of the Royal Society of London: Series B, 2006; 361, 5-22.
19. Schollhorn W. Coordination dynamics and its consequences on sports. International Journal of Computer Science in Sport, 2003; 2(2), 40-46.
20. Frencken W, Lemmink K. Team kinematics of small-sided soccer games: a systematic approach. In: Reilly T, Korkusuz F, eds. Science and Soccer VI, 161-166. London: Routledge, 2008.
21. Frencken W, Lemmink K, Delleman N, Visscher C. Oscillations of centroid position and surface area of soccer teams in small-sided games. European Journal of Sport Science, 2011; 11(4), 215-223.
22. Folgado H, Lemmin K, Frencken W, Sampaio J. Length, width and centroid distance as measures of teams tactical performance in youth football. European Journal of Sport Science, 2014; 14 (Suppl. 1), S487-492.
23. Kim S. Voronoi analysis of a soccer game. Nonlinear Analysis: Modelling and Control, 2004; 9, 233-240. 24. Álvarez JC, Coutts A, Granda J,
Barbero-Álvarez V, Castagna C. The validity and reliability of a Global Positioning Satellite system device to assess speed and repeated sprint ability (RSA) in athletes. J Sci Med Sport, 2010; 13, 232-235.
25. Gray AJ, Jenkins D, Andrews MH, Taagge DR, Glover ML. Validity and reliability of GPS for measuring distance travelled in field-based team sports. Journal of Sports Sciences, 2010; 28(12), 1319-1325.
26. Yue Z, Broich H, Seifriz F, Mester J. Mathematical analysis of a soccer game, Part I, Studies in applied mathematics, 2008; 121, 159-179.
27. Fradua L, Zubillaga A, Caro O, Fernandéz-García AI, Ruiz-Ruiz C, Tenga A. Designing small-sided games for training tactical aspects in soccer: Extrapolating pitch sizes from full-size professional matches. Journal of Sports Sciences, 2013; 31(6), 573-581.
28. Marsh KL, Richardson MJ, Baron RM, Schmidt RC. Contrasting approaches to perceiving and acting with others. Ecological Psychology, 2006; 18, 1-37.
29. Duarte R, Frias T. Collective intelligence: An incursion into the tactical performance of football teams. In: Jemni M, Bianco A, Palma A, eds. Proceedings of the First International Conference in Science and Football (pp. 23-28); Palermo, 2011.