REDUCTION OF WASTE THROUGH
REORGANIZA-TION OF THE COMPONENT SHIPMENT LOGISTICS
Anna Burduk* and Dagmara Górnicka**
*Faculty of Mechanical Engineering, Wroclaw University of Science and Technology, Wroclaw, Lower Silesia Province, 50-370, Poland, Email: anna.burduk@pwr.edu.pl **Faculty of Mechanical Engineering, Wroclaw University of Science and Technology, Wroclaw, Lower Silesia Province, 50-370, Poland, Email: dagmara.gornicka@pwr.edu.pl
Abstract: This paper analyses the operation of a company from the automotive industry in terms of
the identification of waste in the production process. The aim of this study was to develop methods for eliminating the sources of waste, i.e. extensive work-in-progress inventories. There was used the Value Stream Mapping (VSM) method. It allowed finding sources of waste and enabled an analysis of the process. The VSM method allows observing processes exactly as they are, thanks to which it is possible to identify the actual problems occurring in them.
Paper type: Case Study
Published online: 30 April 2017 Vol. 7, No. 2, pp. 77–90
DOI: 10.21008/j.2083-4950.2017.7.2.2 ISSN 2083-4942 (Print)
ISSN 2083-4950 (Online)
© 2017 Poznan University of Technology. All rights reserved.
1. INTRODUCTION
Value stream is "the set of all actions both value-added and non-value-added involved in the process of manufacturing a product or a group of products – from raw material to finished product" (Tapping, Luyster & Shuker, 2002, p. 152). The purpose of Value Stream Mapping is to support the identification of areas that re-quire improvement. This method uses the lean approach. The awareness of the need to identify those areas can be noticed in the economic practice, which is em-phasized by authors of papers on VSM, who write for example that “companies see opportunities for improvements, elimination of waste and resolution of problems through a flow of materials and information with the use of this tool. In addition, almost half of the respondents who responded that they did not use this tool in the analysis of the flow of materials and information, stressed that they would imple-ment it in the near future” (Piasecka-Głuszak, 2014, p. 100). In the studies dis-cussed in this paper, the value stream mapping was the initial step that allowed analyzing the sources of waste occurring in the company and proposing solutions to reduce their impact. The study was performed in a production company which manufactures, among other things, brake calipers. The aim of the study was to identify the sources of waste and propose a manner of streamlining the processes in the company. The scope of the paper covers an analysis of the process of produc-tion of brake calipers – from value stream mapping, through preparaproduc-tion of pro-posals for improving the processes, to assessing the potential benefits resulting from introduction of the improvements.
2. THE PROCESS COVERED BY THE STUDY
Improvement is an extremely important issue, which is confirmed in the scien-tific literature, where the following statement can be found: “to survive and devel-op, each organization must be continuously improved” (Zymonik, Hamrol & Grudowski, 2013, p. 63). Quality standard PN-EN ISO 9001:2009 also refers to the concept of improvement: “organizations should plan and implement processes (...) required for (... ) continuous improvement of the effectiveness of the quality management system” (Polish Committee for Standardization, accessed in 2016). Thus it seems to be obvious that improvement is an extremely important issue both in the management of quality of products or services and in the management of the organization of the whole company. The improvement process consists, among other things, in elimination of waste.
2.1. Production process
A very important action to be performed before designing the maps is the selec-tion of a product or a family of products. Products are divided into families based on the repeatability of the operations. For the analysis, there should be selected a family of products characterized by a similar or identical production process (Rother & Shook, 2003, p. 5).
Table 1. Brake caliper production process
Stage of the production process Operations Operation time [s] Additional time [s] Machining CNC machining 188 1800 Assembly of bushings 90 Final washing 90
Quality control Measurement of roughness 1200 300
Measurement of special characteristics 1151 161
Painting Process of painting in an external company N/A N/A
Assembly
Subassembly of the automatic control unit 116
600
Assembly of the automatic control unit 52
Pressing the levers 18
Assembly of bellows and levers 65
Application of adhesive 17
Assembling the bushing and pressing the cover 48
Screwing the cover 58
Test of hysteresis and automatic control 63
Screwing the bracket to the caliper 32
Assembly of stoppers 24
Test of the profile and displacement 45
Assembly of brake shoes 60
Visual inspection and final assembly 38
Packing of products 65
In this paper, the process of production of brake calipers for trucks has been ana-lyzed. This choice was made due to the fact that at the time of performance of the studies, this was the main product manufactured by the factory. This caliper is made up of many components, out of which the most important and requiring the greatest labor input is the brake caliper housing. Mapping was performed along the route of this component. The company manufactures this component from the machining of
the casting supplied to the installation in the brake caliper. The processes taking place in the company represent the entire production. They can be generally grouped into machining, quality control and assembly. These are three main parts that consist of individual operations. They have been summarized in Table 1.
The extra time included in Table 1 is, respectively for machining and assembly, the time of changeovers and replacement of components, while for quality control – the time required to mount the component in the machine as well as any addi-tional activities performed during laboratory measurements. The situation is differ-ent in the case of painting of the housings – this process will be discussed in more detail further in the paper.
2.2. Assumptions and additional information
Designing a map of the current state for an existing, real company requires adopt-ing certain assumptions and simplifications. This results from the fact that the value stream mapping is a universal method and therefore its application to this specific case requires analyzing the data acquired, taking into account the needs of the VSM method. Approx. 75% of demand for brake calipers is satisfied by the factory dis-cussed in this paper. The customer orders 2160 pcs of calipers per week (including 1080 pcs of the right variant and 1080 pcs of the left variant). Therefore, for the needs of the project, customer's demand for ready components was decreased by 25%, i.e. to the level of 1620 (calculated as 75% of total demand of 2160 pcs).
Table 2. Inventory levels and assumptions
Type of inventory Inventory level Unit
Inventory level before CNC – safety inventory level 2000 pieces
Inventory level after machining 648 pieces
Inventory – Quality Control 44 pieces
Inventory – assembly (blocked on QC) 958 pieces
The volume of shipment of components for painting ranges from 900 pcs to 1080 pcs. According to the data obtained, 8 pcs from each shift are subjected to control (approx. 220 pcs are made per shift). Therefore, an intermediary solution has been adopted in the project: 990 pcs transported for painting in an external company. In this case, the laboratory gets 36 pcs and this is the inventory level that can be accumulated before the quality control performed in the laboratory. The inventory level from the previous order identified in the company was added to this value, which gives in total 44 pcs. In this case, the remaining 954 pcs are blocked in the quality control area and are released to the process after making measurements on samples, if they do not deviate from the requirements. In addi-tion, in the assembly process, 4 additional pcs were observed in inventories, which
was also taken into account. There were 958 pieces in total. Table 2 summarizes the above assumptions as well as the inventory levels in the company.
2.3. The process of painting the housings in an external company
The determination of the times of the painting process was more problematic. In more detail, this process consists in covering the housings with anti-corrosion coating. Therefore, it has primarily a functional aspect (protection of a caliper against corrosion) but also performs an aesthetic function (coating changes a color of the housing). The company outsources this operation to an external entity. After the housings have been painted, they are returned to the company. Then the quality control is performed and they are directed to the assembly process.
According to the surveys carried out in the company, 900 to 1080 pcs of the casts (the project assumed 990 pcs) that have been machined earlier are sent to the external company. The process of painting and transport from and to the external company takes in total two weeks, i.e. 10 working days (252,000 seconds). The housings that have been machined earlier are transported twice a week in packaging containing 36 pieces of components each.
In the scope of the studies performed, the process of painting (covering with anti-corrosion coating) cannot be broken down into the time of processing and the lead time based on the real values. Considering a lack of access to the data on the process of painting (covering with anti-corrosion paint), the data concerning the duration of such a process were found in the website of a manufacturer of anti-corrosion paints (Colorak Polska, accessed in 2016). According to the manufacturer's descrip-tion, the time of drying, depending on the type of coating, ranges from 3 to 7 days. The time of the painting process in an external company is 10 working days. Thus, for the needs of this study, the average drying time of 5 days will be adopted.
The process of painting and the process of transport (in both ways) take remain-ing 5 workremain-ing days. In order to estimate the time of transport, two factors should be considered: the distance between the external company and the factory (the travel-ling time is a little more than 8 hours one way) and the fact that the drivers trans-porting the components do not work 8 hours a day but more. Thus, it can be as-sumed that the drivers can cover the entire distance (in both ways) in one day (full day, not working day), while having the time for a break. Therefore, the assump-tion that out of the remaining five days, one day is spent on the transport seems to be safe. In connection with the above, there remain 4 working days, during which anti-corrosion coating is applied on the components. Assuming that the external company operates in a similar manner (1 shift, 8 working hours each, including 1 hour for a break and additional activities), 4 working days account 28 hours (100,800 seconds). The company sends, as it has been calculated earlier, 990 com-ponents on average, so the estimated processing time of one component is slightly less than 101 seconds. It should also be taken into account that in the area, in which
adequate conditions for drying should be ensured, the monitoring of every single piece would not be economically justified. It has been assumed in this project that all the ordered products (990 pcs) can be dried at the same time. These assumptions and the results of estimations are given in Table 3.
Table 3. The process of covering the housings with anti-corrosion coating in the external company
Time Days Hours Seconds
Transport from/to the company 1.00 24.00 86400.00
Covering a component with anti-corrosion coating (1
piece) N/A 0.03 100.80
Drying of the anti-corrosion coating (batch of 18 pieces) 5.00 35.00 126000.00 Drying of the anti-corrosion coating (1 piece) 0.28 1.94 7000.00 Processing time (Value Added, one piece of component) 0.28 1.97 7100.80
Lead time 10.00 70.00 252000.00
Production batch 18.00 pieces
It should be emphasized that both the process of covering the components with anti-corrosion coating and the process of drying are value-adding activities, as they affect the resistance of the components to corrosion, which is a feature important for the customer.
3. VALUE STREAM MAPPING IN THE COMPANY EXAMINED
The value stream mapping method allows analyzing all the processes occurring within the company during the manufacture of the product and helps identify the areas that can be improved. It happens very often that VSM indicates a disparity between the number of value-added activities and the number of the activities that do not add value in companies. The key objective that can be achieved by using the value stream mapping is to cause that the analyzed process “consists in the largest part of value-added activities” (Czerska, 2009, p. 22). Of course, this objective should be achieved not by extending the time of these activities, but by reducing the time spent on the performance of non-value-added activities. The processes exam-ined during the value stream mapping have been grouped according to Table 1. This division results from the fact that there occurs a one-piece flow between indi-vidual operations within the whole group, which allows merging these operations.
3.1. Map of the current state
"Value Stream Mapping is a graphical representation of all the processes neces-sary to deliver the final product or service to the customer (external or internal)" (Adamczak, Domański, Cyplik & Pruska, 2013, p. 258).
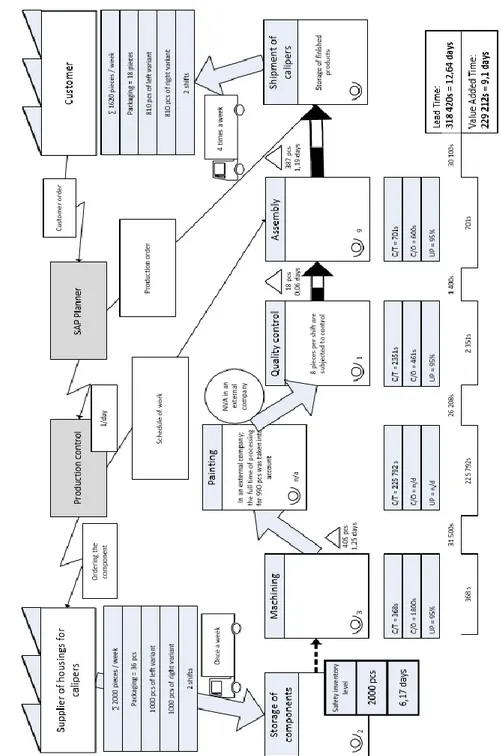
Therefore, in accordance with the information given earlier in the paper and the methodology of performing the value stream mapping, the map of the current state has been designed, which is shown in Figure 1. In accordance with the measure-ments and calculations performed, taking into account the shipment and the paint-ing of the components in the external company, the whole process takes 383,454 seconds, i.e. over 15 working days. Out of this, 229,212 seconds, that is 9.1 days, is the time spent on processing. In order to present the data in a more clear way, they were converted into percentage values and summarized in a form of a graph in Figure 2.
Fig. 2. Share of the VA and NVA times in the entire production process
According to the information given in Figure 2, almost 60% of the time is spent on the value-added operations, while approx 40% – on non-value-added operations. This is still a very large part of the process, which is a phenomenon unfavorable for the company, because "one of the most important goals of the logistics is to add value" (Klepacki & Gidziński, 2015, p. 65). In the company in question, this results from the accumulation of vast amounts of inventories in connection with the ship-ment of the components to an external company. Despite the fact that the company attaches importance to the flow of a single piece within the processes, this is still a big problem due to inventories of hundreds of pieces accumulating between processes. This problem not only extends the overall time of production, but also generates the need of storing inventories which occupy the space available in the factory. These are sources of waste in this company.
3.2. Areas of improvement, proposal of improvement
Considering the fact that the WIP inventories have been identified as one of the main sources of waste, a proposal of reorganizing the shipments of components prepared. The only element that could generate additional costs in this solution is
the increase in the frequency of shipment of housings for painting – from two to four times a week.
Thus, the project of improvements assumes limiting the inventory level in the company by reducing the batches of housings sent for painting from 990 pcs to 405 pcs. This number was determined based on the following calculations: the custom-er ordcustom-ers 1620 pieces of calipcustom-ers a week, including 810 pieces of the left variant and the 810 pieces of the right variant. Hence the reduction of the shipment volume to 405 pcs was adopted, which represents a quarter of the weekly customer's de-mand. This is also caused by the fact that the shipment to the customer takes place four times a week, so 1620 pieces divided into four travels is just 405 pieces. Mak-ing the number of pieces sent for paintMak-ing equal to the number of pieces sent to the customer should lead to streamlining and reducing the inventory level.
Table 4. The data before and after the change in the dispatch of components for painting
Before the change After the change
Size of shipment 990 pieces 405 pieces
Frequency of the dispatch of components for
painting 2 times/week 4 times/week
Frequency of the dispatch of finished
products to the customer 4 times/week 4 times/week
The time of collecting the inventory for one
shipment for painting 4.5 shifts 2 shifts
Inventory level: machining 648 pieces 405 pieces
Inventory level: quality control 44 pieces 18 pieces
Inventory level: assembly 958 pieces 387 pieces
Furthermore, one shift of machining produces approximately 220 calipers. Therefore, in order to send 990 pcs of housings for painting, 4.5 shifts are needed, i.e. over two working days. During that time, more and more inventories are accu-mulated in the company. A reduction in the shipment volume to 405 pcs will cause that the production of one batch of components will take less than two shifts, i.e. one working day. This means that the inventories which have been generated since the morning will disappear from the company by the end of the second shift on the same day at the latest. This will also result in a reduction in the inventory of components blocked at the quality control and before the control process itself. 8 pieces per shift are subjected to measurements. This means that 36 pcs are need-ed to perform adequate control for the shipment volume of approx. 990 pcs. In the case of a reduction in the shipment volume to 405 pcs, it is sufficient to control 18 pcs of the product. This means a reduction of the maximum possible level of inventories associated with quality control and thus a reduction in the number
of blocked pieces from 954 to 387. The data collected before and after the pro-posed change are presented in Table 4.
The estimated inventory levels after the introduction of the proposed change were calculated as the maximum values that may occur in accordance with the precautionary principle. As a result, it can be stated that the company should achieve a level of savings at least the same as estimated in the project. It should be emphasized that the aforementioned proposal of improvements requires from the company only a reorganization of the shipment logistics without incurring any expenses other than those associated with covering the components with anti-corrosion coating outside the company.
3.3. Map of the future state
Knowing the changes in volumes, the map of the future state can be developed. This map is presented in Figure 3.
As it can be observed, the processing stage is not changed in any way in the proposed improvement and therefore it takes the same time, i.e. 9.1 days. The sit-uation is different in the case of the lead time, which is shortened as a result of the reduction in inventories to 12.64 days.
4. CONCLUSION
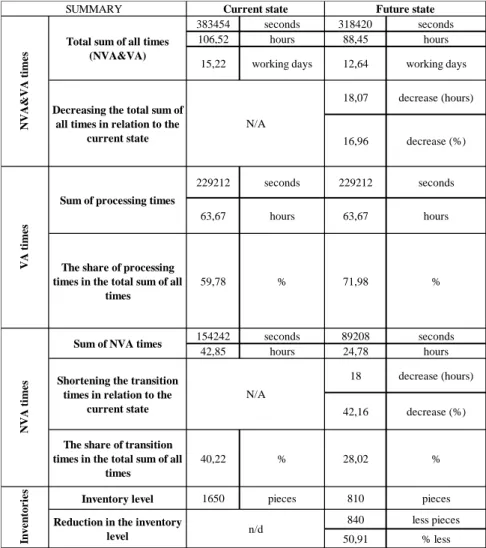
Table 5 summarizes the calculated total sum of all the times observed in the cur-rent state and in the planned future state of the company.
Table 5. Summary of potential benefits
383454 seconds 318420 seconds
106,52 hours 88,45 hours
15,22 working days 12,64 working days
18,07 decrease (hours)
16,96 decrease (%)
229212 seconds 229212 seconds
63,67 hours 63,67 hours
The share of processing times in the total sum of all
times 59,78 % 71,98 % 154242 seconds 89208 seconds 42,85 hours 24,78 hours 18 decrease (hours) 42,16 decrease (%)
The share of transition times in the total sum of all
times
40,22 % 28,02 %
Inventory level 1650 pieces 810 pieces
840 less pieces 50,91 % less In ve n tor ie s
Reduction in the inventory
level n/d SUMMARY V A ti me s
Sum of processing times
N V A ti me s
Sum of NVA times
Shortening the transition times in relation to the
current state
N/A
Current state Future state
N V A &V A ti me s
Total sum of all times (NVA&VA)
Decreasing the total sum of all times in relation to the
current state
N/A
It is worth noting that despite the lack of interference in the processing opera-tions, their share in the total processing time has changed, i.e. it increased from the level of less than 60% to almost 72%. This increase is caused by a reduction in the lead time, which is a desirable effect as it means that a greater portion of the total time spent on the production generates a value for the customer. Reduction in the lead time from over 15 working days to slightly more than 12.5 working days may
not be a spectacular achievement, but the scale of the proposed changes should be emphasized – it is very small and should generate only slight, barely noticeable costs. However, due to a lack of data, the financial part of the improvement is not analyzed in detail in this study. Much more noticeable improvement can be ob-served in the area of inventory accumulation – the inventory level should decrease from 1650 pcs to no more than 810 pcs. This means a reduction in the inventory level by more than half, which entails benefits not only in the form of shortening the production time, but also, and perhaps primarily – in the form of saving a lot of space in the production hall.
The aim of the study was to identify the sources of waste and propose a manner of streamlining the processes occurring in the company. This aim was achieved by using value stream mapping, with particular emphasis put on the reduction of inven-tories, which turned out to be the biggest problem for the company resulting from outsourcing a part of the process to an external company. The method of value stream mapping used in this paper allowed identifying the sources of waste. It was used to design the solutions that improve the processes, with a special emphasis put on the analysis of the value stream. The aim of the studies has been achieved. According to the calculations performed, the implementation of the proposed im-provements should bring measurable benefits for the company in the form of reduc-ing the inventory levels accumulated in the course of production by more than half. In connection with this reduction, the time of production of brake calipers should be decreased by nearly 2.6 working days. As a result, the share of processing operations in the total processing time should be increased to almost 72%, i.e. by over 12 per-centage points, which is a very desirable effect in the economic practice.
All the calculations and estimations of profits for the company described in this paper should be discussed and analyzed in close consultation between the company management and the logistics department involved in the shipment of components in order to optimally adjust the changes to the needs and plans of the company.
REFERENCES
Tapping D., Luyster T. & Shuker T. (2002), Value Stream Management: eight steps to plan-ning, mapping and sustaining Lean improvements, Ed. Productivity Press, New York. Piasecka-Głuszak A. (2014), "Lean management w polskich przedsiębiorstwach przy wykorzystaniu wybranych narzędzi rozwiązywania problemów – wyniki badań", Research Papers of the Wroclaw University of Economics, vol. 369, pp. 88–103. Zymonik Z., Hamrol A. & Grudowski P. (2013), Zarządzanie jakością i bezpieczeństwem,
Polskie Wydawnictwo Ekonomiczne, Warszawa.
Polish Committee for Standardization, PN-EN ISO 9001: 2009 – Quality Management System [accessed on: 07.03.2016].
Womack J.P. & Jones D.T. (2001) Odchudzanie firm: eliminacja marnotrawstwa – kluczem do sukcesu, translated by R. Jańska, publisher: Centrum Informacji Menedżera, Warszawa.
Rother M. & Shook J. (2003), Naucz się widzieć: eliminacja marnotrawstwa poprzez Ma-powanie Strumienia Wartości, publisher: The Lean Enterprise Institute, Polish edition: Wroclaw Centre for Technology Transfer at the Wroclaw University of Technology. Colorak Poland Sp. z o.o. – manufacturer of industrial paints and varnishes, data on
covering metals with anti-corrosion coating, http://www.colorlak.pl/ [accessed on: 21.03.2016].
Czerska J. (2009), Doskonalenie strumienia wartości, publisher: Centrum Doradztwa i in-formacji Difin, Warszawa.
Adamczak M., Domański R., Cyplik P. & Pruska Ż. (2013), The tools for evaluating logistics processes, Scientific Journal of Logistics, vol. 9, pp. 255–263.
Jiménez E., Tejeda A., Pérez M., Blanco J. & Martínez E. (2012), Applicability of lean production with VSM to the Rioja wine sector, International Journal of Production Research, vol. 50, pp. 1890–1904.
Klepacki B. & Gidziński M. (2015), Inteligentna logistyka jako element kreowania wartości dodanej dla klienta, Studies & Proceedings of Polish Association for Knowledge Management, vol. 73, pp. 58–66.
BIOGRAPHICAL NOTES
Anna Burduk is an Associate Professor of Wroclaw University of Science and
Technology. She works at Faculty of Mechanical Engineering in Laser Technologies, Automation and Production Management Department. Her research interests are: stability of production systems, implementation of intelligent methods for production process control and optimization of production systems. She is the author and co-author of more than 50 research papers.
Dagmara Górnicka is a PhD student at the Laser Technologies, Automation and
Production Management Department (Faculty of Mechanical Engineering, Wroclaw University of Science and Technology, discipline: Production Engineering). She has been awarded with honorable mentions in competitions for the Best Graduate of the Faculty of Mechanical Engineering at the Wrocław University of Technology – 1st degree (7th place, 2015) and 2nd degree (5th place, 2016). Her areas of interest include production quality, production engineering, as well as improvement and optimization of production processes
![Table 1. Brake caliper production process Stage of the production process Operations Operation time [s] Additional time [s] Machining CNC machining 188 1800 Assembly of bushings 90 Final washing 90](https://thumb-eu.123doks.com/thumbv2/9liborg/3053963.6918/3.892.173.721.463.897/production-production-operations-operation-additional-machining-machining-assembly.webp)