UNDERGRADUATE DISSERTATION
‘Contrasting the strategic role of firms in the economic
development of Ecuador with that of South Korea using
Ghemawat CAGE distance framework’
BA in Business and Management by Maria Eliani Fabre Herrera
Dissertation supervisor: Monika Kostera March 2017 Word count = 11,997
TABLE OF CONTENTS
ACKNOWLEDGEMENTS………...………1 ABSTRACT………...2 CHAPTER 1: INTRODUCTION ... 3 1.1 Context ... 3 1.2 Research Aims ... 3 1.3 Research Importance ... 4 1.4 Research Rationale ... 4 1.5 Research Framework ... 4 1.6 Structure ... 5
CHAPTER 2: LITERATURE REVIEW ... 6
1.7 Introduction ... 6
1.8 Country Competitiveness ... 6
1.8.1 Industry-Level Determinants ... 7
1.8.2 Country-Level Determinants ... 7
1.9 The Role of Firms ... 7
1.9.1 Location Advantages & Firm-Specific Advantages ... 8
1.9.2 Firm-Level Determinants ... 9
1.9.3 Influencing Factor Creation ... 9
1.9.4 Organising Principles & Technological Innovation ... 10
1.10 Ghemawat’s CAGE Framework ... 10
1.10.1 Geographic Distance ... 11 1.10.2 Cultural Distance ... 11 1.10.3 Administrative Distance ... 13 1.10.4 Economical Distance ... 13 CHAPTER 3: METHODOLOGY ... 18 1.11 Introduction ... 18 1.12 Research Purpose ... 18 1.13 Methodology ... 18 1.13.1 Research Philosophy ... 18 1.13.2 Approach ... 18
1.14 Methodological choice & Time Horizon ... 19
1.14.1 Financial and Efficiency Metrics ... 20
1.14.2 Customer Metric ... 21
1.14.3 CAGE Distances Analysis ... 22
1.15 Strategy ... 22
1.16 Techniques and Procedure ... 25
1.16.1 First Research Question: Strategy of firms ... 25
1.16.2 Second Research Question: Replicability of strategies ... 29
1.17 Research Ethics ... 30
1.18 Limitations ... 31
CHAPTER 4: CASE STUDY OF ECUADORIAN AND SOUTH KOREAN COMPANIES ... 32
1.19 Introduction ... 32
1.20 Case Study A: Strategies used in firms from Ecuador in contrast to South Korea ... 33
1.20.1 Case A.1. Key Performance Indicators ... 33
1.20.2 Case A.2. Strategy ... 62
1.20.3 Case A.3. Productivity of firms ... 63
1.21 Case Study B: Contrasting Ecuador & South Korea through CAGE analysis ... 64 1.21.1 Cultural Distance ... 64 1.21.2 Administrative Distance ... 66 1.21.3 Geographic Distance ... 67 1.21.4 Economic Distance ... 69 CHAPTER 5: IMPLICATIONS ... 74
CHAPTER 6: CONCLUSION & RECOMMENDATIONS ... 75
1.22 Which strategies were used in firms from Ecuador in contrast to South Korea? (Internal Factors) ... 76
1.23 Can Ecuador replicate the techniques used by South Korea to stimulate rapid growth? (External Factors) ... 76
1.24 Strategic Role of Firms ... 77
1.25 Recommendations ... 78
REFERENCES ... 79
Appendix ... 87
1.26 Survey: Customer Satisfaction for Ecuadorian companies ... 87
LIST OF FIGURES
Figure 1. Resource-Based View ... 8
Figure 2.Firm-Level Determinants ... 9
Figure 3. Case Study Strategy ... 22
Figure 4. Procedure followed for measuring Economic Development ... 26
Figure 5. Comparison of yearly averages of Revenue Growth Rate from South Korean and Ecuadorian companies ... 46
Figure 6. Customer Satisfaction: Comparison between Ecuadorian and South Korean companies ... 59
Figure 7. Cultural Similarities & Differences ... 64
Figure 8. South Korea Merchandise Exports with Shading Based on Partners Imports in 2010 ... 68
Figure 9. Ecuador Merchandise Exports with Shading Based on Partners Imports in 2010 ... 68
Figure 10. Total GDP of Ecuador and South Korea in 2016 ... 69
Figure 11. GDP per capita of Ecuador and South Korea in 2016 ... 70
Figure 12. Income inequality from Ecuador and South Korea in 2016 ... 71
Figure 13. Unemployment of Ecuador and South Korea in 2016 ... 72
Figure 14 Strategic Role of Firms ... 75
LIST OF TABLES
Table 1. Cultural Distance Framework ... 12
Table 2. Administrative Distance Framework ... 13
Table 3. Economic Distance ... 14
Table 4. Synthesis of main theoretical frameworks from the Literature ... 16
Table 5. KPIs Methodological Framework ... 19
Table 6. Yearly Exchange Rate from Korean Won to US Dollars ... 20
Table 7. Likert Scale ... 21
Table 8. Contribution to GNI in 2015 ... 24
Table 9. Analytical methods from previous studies ... 25
Table 10. Metrics used for analysing performance ... 27
Table 11. Formulas to measure the KPIs ... 28
Table 12. GLOBE scale ... 29
Table 13. South Korea: Financial, Internal Business and Learning & Growth Metrics ... 33
Table 14. Ecuador: Financial, Internal Business and Learning & Growth Metrics ... 36
Table 15. South Korea: Revenue Growth Rate (RGR) ... 39
Table 16. South Korean GDP from 2007-2012 ... 39
Table 17. Yearly Exchange Rate from Korean Won to US Dollar ... 40
Table 18. GDP growth rate of South Korea in year 2013-2015 ... 40
Table 19. Three main export partners of South Korea in 2014-2015 ... 41
Table 20. One Korean Won in other currencies ... 42
Table 21. Countries yearly conversion rate from Korean Won ... 42
Table 22. Export partners from South Korea in 2014, 2015 ... 43
Table 23. Ecuador: Revenue Growth Rate ... 43
Table 24. Ecuador’s GDP from 2007-2012 ... 43
Table 25. Industry sector of Ecuadorian companies ... 44
Table 26. Market Share of Ecuadorian Industries in 2014 & 2015 ... 45
Table 27. South Korea: Net Profit & Percentage change per year ... 47
Table 28. China GDP growth ... 48
Table 29. LG Chem main Competitors Net Profit in 2013 ... 49
Table 30. Ecuador: Net Profit & percentage change per year ... 50
Table 31. Expenses of Pronaca in year 2012 & 2013 ... 51
Table 32. Expenses of Pichincha Bank from 2011 to 2013 ... 51
Table 33. Percentage Share of Revenue to GNI ... 52
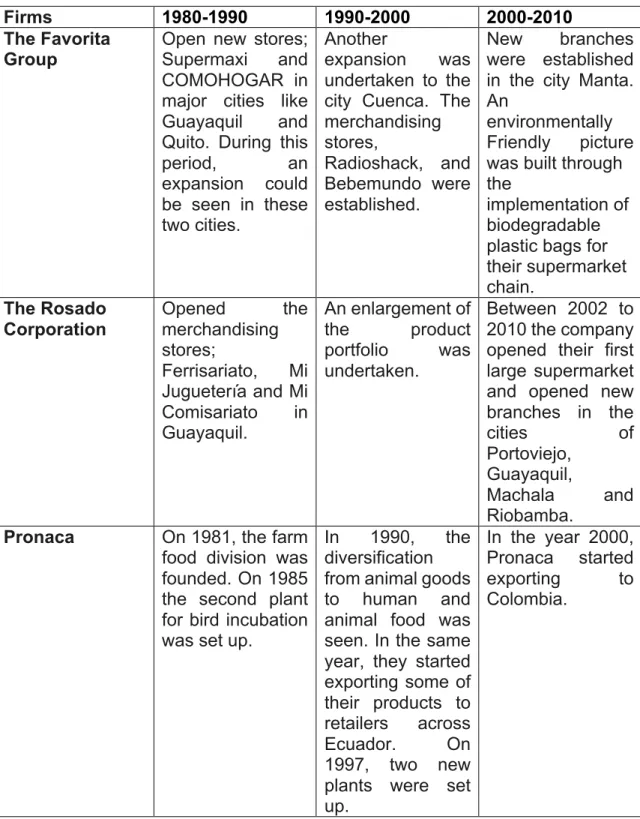
Table 34. Number and Location of Supermarkets from The Favorita Group ... 53
Table 35. Profit margin of Ecuador & South Korea ... 54
Table 36. South Korea: Asset Turnover Ratio ... 56
Table 37. Ecuador: Asset Turnover Ratio ... 57
Table 38. South Korea: CSI ... 58
Table 39. Ecuador: CSI ... 59
Table 40. South Korean and Ecuadorian firm-strategies ... 62
Table 41. Comparing the Administrative Distances from South Korea and Ecuador ... 66
ACKNOWLEDGEMENTS
I would like to give particular gratitude to Prof. Monika Kostera for her guidance throughout the dissertation process. The support and advice received from her have been extremely valuable for me to complete and continuously improve this piece of work.
I would also like to thank Mr. Tizian Römmelt for his immense support in throughout the writing of this paper. The financial knowledge shared to me has been essential for the advancement of this work. Further, I am grateful to my family for all the encouragement given for the completion of this study.
ABSTRACT
The following study discusses the strategic role that firms have on the economic development of a country. For this, two countries were selected;; South Korea and Ecuador. Both countries experienced an economic boom in 1980. However, some years later Ecuador had a pitfall in their economy. On the other hand, South Korea's economy upraised. The study analysed two areas;; the strategies made by both countries, and the replicability of these strategies.
In order to achieve this, firstly, a longitudinal exploration since 1980 to 2015 of the Key Performance Indicators (KPIs) from five companies of each country was analysed. The results showed, South Korean companies focus more on a differentiation strategy, which opposes to the strategies undertaken by Ecuadorian companies.
Secondly, the study continued by contrasting the distances of both countries, therefore, enabling to see how replicable were the strategies of South Korea to the Ecuadorian companies. For this Ghemawat's CAGE distance framework was utilised and demonstrated the vast administrative, economical and geographical distances from both countries, which refrained Ecuadorian companies from replicating the South Korean strategies.
This study concludes and support the literature by implying that the strategies used by firms affect productivity, therefore, competitiveness and economic development of a country.
CHAPTER 1: INTRODUCTION
1.1 Context
The second oil shock, which occurred in 1979 as a result of an oil supply decrease, drove the prices to rise substantially (Archanskaïa et al. 2012). For countries like South Korea, who are importers of crude oil, the latter represented a negative impact on their economy. However, for exporters such as Ecuador, the situation was the opposite. (De La Torre, 1987). Regardless of the international context, both countries managed to strengthen their economy in the beginning of 1980.
Despite Ecuador had a more promising economic development than South Korea,it is struggling to develop. Conversely, South Korea, whose institutions were unreliable and its economy, depended on counterfeit production (Chang, 2009), started a process of forward engineering which allowed them to develop.
Moreover, the economy of both countries was in a similar situation. However, what did Ecuador do differently than South Korea? In addition, to what extent these decisions, prevented the country to ensure a continuous development? The course of this study focuses on contrasting the roles firms occupied in each country and the impact these had on the competitiveness of their respective country.
1.2 Research Aims
The overall aim of this study focuses on understanding into which extent are firms favourable for the development of economies. In order to achieve it, Ecuador and South Korea cases are utilised as a foundation for achieving the absolute objective. Furthermore, this study targets the following research questions
1. Which strategies were used in firms from Ecuador in contrast to South Korea?
2. Can Ecuador replicate the techniques used by South Korea to stimulate rapid growth?
1.3 Research Importance
Generally, there has been an array of studies analysing the factors affecting economic development of a country. Nevertheless, the contrast between Ecuador, characterised by fraudulent institutions and a fragile economy, and South Korea a developed country;; has not been researched before. Therefore, allowing this study to contribute with a pioneering perspective on the effect that firms, along with its different strategies, from these countries have upon the competitiveness of their respective country.
The question here is whether the techniques used in South Korea can be applied in Ecuador or what other factors are at work. As a result, this study is of high significance as it reflects on real-life situations, which have not been previously explored.
1.4 Research Rationale
The reason for selecting Ecuador and South Korea firstly, relied on the economic situation experienced by both countries in 1980, as previously discussed. Consequently, situating them in a similar economic stage at a specific period. Secondly, the analysis of two opposite countries, in terms of their economic development, will enable a wider and richer exploration of the varied decisions taken by each country and will show the reasons for the success of South Korea in comparison to Ecuador. Therefore, learning through the contrast of a developed and an underdeveloped country.
1.5 Research Framework
Ghemawat (2001), suggests that distance between countries matters. He depicts a model, which include Cultural, Administrative, Geographical, Economical (CAGE) distances which affect firm strategies and decision-making. Furthermore, this framework enables the comparison of the distances entailed between South
Korea and Ecuador. Therefore, enabling the analysis of whether the strategies made by each country can be replicated in the Ecuadorian firms, or cannot.
1.6 Structure
The following dissertation is divided into four sections. Firstly, the literature review will analyse the most relevant existing studies concerning the topic of research. Secondly, the methodology will explain the methods used for acquiring the primary and secondary data. Thirdly, the evaluation of the Case Study A & B will be undertaken, in order to understand the strategies concerning to each country, as well as, the extent of which these can be replicated and the overall implications. Lastly, the conclusion will synthesise and give further recommendations for this study.
CHAPTER 2: LITERATURE REVIEW
1.7 Introduction
The purpose of this chapter is to explore and to critically analyse previous studies, which aid in answering which specific roles firms undertake for improving the economy of a country. In order to achieve this, firstly the exploration of the main determinants that support productivity generation will be evaluated.
Secondly, the firm-level determinants will be further explored and related to the role of firms. In order to achieve this, firm strategy theory will be analysed, therefore, understanding the process in which firms manage their strategies. Thirdly, the CAGE model will be explained and combined with previous theories. Therefore, determining ‘distance’ as an essential factor when contrasting two countries.
1.8 Country Competitiveness
Countries that are capable of creating higher wealth than its competitors are defined as competitive. In order to have this advantage, productivity is essential. The latter highly depends on the quality of the product or service offered and the efficiency of which these are produced. Additionally, productivity is affected by industry, country (external factors), as well as, individual, and firm-level determinants (internal factors) (Shenkar et al. 2015).
The authors suggest that the impact a country competitiveness has upon firms, is high. To begin with, it affects the location into which firms aim to operate. Secondly, it determines the industry in which the country will have a competitive advantage. Thirdly, it affects the level of innovation developed by firms. Generally, all these aspects eventually affect the strategy of firms. The following external factors are considered.
1.8.1 Industry-Level Determinants
The macroeconomic business environment is essential for the competitiveness of the industry. According to Porter’s Diamond (1990), the components for strengthening or weakening an industry are fourfold;; factor & demand Conditions, supporting industries and rivalry.
1.8.2 Country-Level Determinants
At this level, political, economic, and legal stability are the cornerstone for productivity. In order to attain it the following components need to be resilient;; institutional System, infrastructure, macroeconomic soundness, education & science, internationalization.
Generally, these factors are external forces, which affect firm performance. Therefore, the behaviour of firms will be influenced by the context in which they reside. However, Coulter (2005), suggests that strategies are elaborated by scanning and evaluating not only the external environment of a firm but also the firm context. This allows companies to utilise different methods to achieve their strategies.
1.9 The Role of Firms
There has been previously discussed three aspects, which affect competitiveness. Nevertheless, these components would become obsolete without the presence of firms. In other words, without external factors, such as, an infrastructure, no companies would be founded. However, without companies no infrastructure would be able to be constructed. In other words, it is a cyclical dependency where firms play a major role in initiating it. This is feasible through the capability of firms, to gather an array of knowledge, capital, and resources, which can be deployed in various markets without being so affected by the industry and country-level determinants.
1.9.1 Location Advantages & Firm-Specific Advantages
This enables to build on the idea that the previous components are essential for businesses to be productive by exploiting the Location Advantages (LAs) (Cuervo- Cazurra et al. 2014). For instance, if firms reside in country X that possesses a high country and industry levels, then their performance will be benefitted.
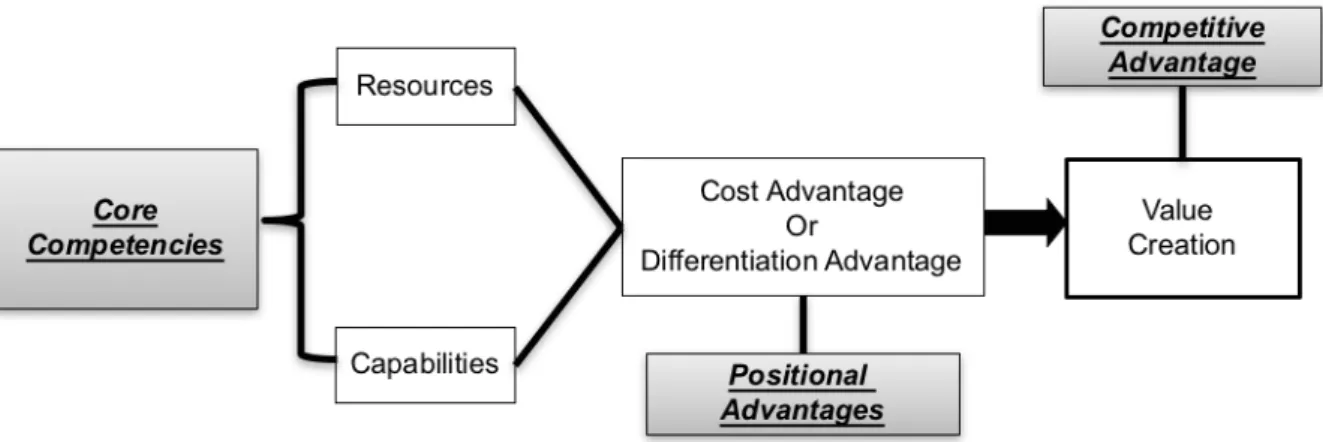
Nonetheless, it is not necessary the existence of a perfect market or an attractive country for firms to influence the environment, which affects country competitiveness, that is, country, industry and individual-level determinants. For instance, by developing Firm-Specific Advantages (FSAs), in other words, the internal capabilities and resources for value creation;; create a competitive advantage (Barney & Mackey, 2016).
Figure 1, depicts the positional advantages, the resources and capabilities (FSAs) that a firm generates. These advantages reflect the strategy employed by the business, that is, cost leadership or differentiation strategy. Overall, these complement to the generation of value within the company.
Figure 1. Resource-Based View
Source: Adapted from Barney & Mackey, (2016)
1.9.2 Firm-Level Determinants
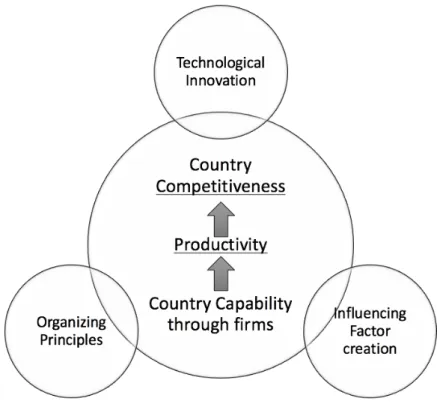
There are three factors from firms which affect productivity, these are;; technological innovation, organising principles and factor creation, as seen in Figure 2. The two first are some of the FSAs a company can develop for contributing to factor creation.
1.9.3 Influencing Factor Creation
Factor creation is the ability of firms to develop strong internal resources and capabilities (FSAs), which allow them to develop a competitive strength. For instance, by investing in R&D firms can develop innovative products, which create a competitive advantage. Therefore, it can influence the environment that affects the competitiveness of a country, as seen in Figure 2.
Figure 2.Firm-Level Determinants
Source: Shenkar et al. 2015, pp. 177
1.9.4 Organising Principles & Technological Innovation
Moreover, as long as the organising principles of a firm focus on differentiation strategies, companies can develop a competitive advantage vis-à-vis to competition. For instance, Kaizen system allowed Toyota to become more efficient when manufacturing cars, as well as, to be successful in international markets (Womack et al. 2007).
Additionally, technology & innovation are also essential for making business operations more efficient and effective, which strengthens the differentiation strategy of a firm. For example, IT has been one essential factor for optimising efficiency on operating costs within the Brewery Industry (Johnson et al. 2008). However, in this highly competitive industry, this specific FSA is highly replicable. Thus, a continuous development and creation of technology and innovation is needed to maintain an advantage from competitors.
1.10 Ghemawat’s CAGE Framework
Previous models have debated the importance of geographical distance and to some extent the cultural distance. Ghemawat (2001), supports the idea that distance matters, however, there is a contribution of a wider view of what distance means. Moreover, internal distance or measurable aspects such as GDP per capita, as well as, an external distance such as linguistic differences should be accounted for (Ghemawat, 2011).
Furthermore, firms then need to think about borders or distances when making strategies. Moreover, the role of firms depends widely on the distance factors entailed between different countries. Ghemawat (2001) considers the following factors affecting distance.
1.10.1 Geographic Distance
The ‘Gravity Model of International Trade’, created by Jan Tinbergen (Squartini & Garlaschelli, 2014) explains that the wider the distance between two countries, the lower the trade. Distance, according to the model can be explained by the income level, economic size, physical distance, access to the ocean, and common borders shared by two or more countries.
Nonetheless, information technology has allowed the reduction of physical distances. For instance, technological savvy businesses such as eBay, which use up-to-date technology for improving their logistics, have allowed trade from countries which have a high geographical distance between each other (Hortaçsu et al. 2009). Moreover, it does not only reduce geographical distance but also costs. Consequently, the Internet of Things have allowed the emergence of cyber- physical systems where connectivity is the pattern (Laudon & Laudon, 2016). As a result, leaving the gravity model as an outdated archetype, which needs to be carefully considered and adjusted to the current environment.
Krugman (2004) opposed this view by indicating that despite the reduction in transportation costs enabled by technology, borders still matter and only if two economies are geographically close there will be an agile economic development. Generally, this theory would suggest that technology is, in fact, reducing to some extent physical distances but it does not cover many other types of distances.
1.10.2 Cultural Distance
According to Huntington & Brzezinski (2007), culture affects the levels of cohesion, fragmentation and conflict between countries. Culture allows the development of an identity, which affects behaviours. These can positively or negatively affect the chosen trading countries, as well as, the level of trading.
Moreover, culture has been highly debated. Hofstede’s study has been one of the most influential in the last decade. This aimed to measure the cultural
characteristics of societies (Hofstede, 2011). However, the study was too simplistic as culture is an intangible aspect of society, therefore, making it difficult to measure it.
The GLOBE research furthers the analysis of culture commenced by Hofstede. It bases on the examination of value orientation through nine cultural dimensions;; uncertainty avoidance, power distance, institutional collectivism, in-group collectivism, gender egalitarianism, assertiveness, future orientation, performance orientation, and humane orientation (House et al. 2004). Nonetheless, the model still does not take into consideration the abstract concept of culture.
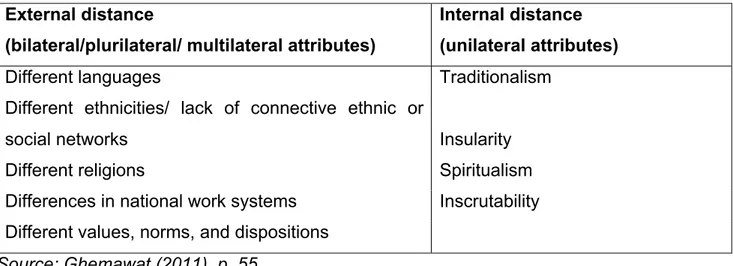
Moreover, Ghemawat (2001) contributes to previous research about culture by exploring two perspectives of culture the internal and external.
Table 1. Cultural Distance Framework External distance
(bilateral/plurilateral/ multilateral attributes)
Internal distance (unilateral attributes)
Different languages Traditionalism
Different ethnicities/ lack of connective ethnic or
social networks Insularity
Different religions Spiritualism
Differences in national work systems Inscrutability Different values, norms, and dispositions
Source: Ghemawat (2011), p. 55
The variables presented show attributes which can be shared with two or more countries (bilateral/plurilateral/multilateral attributes), as well as, variables shared with one country (unilateral).
1.10.3 Administrative Distance Table 2. Administrative Distance Framework
External distance (bilateral/plurilateral/multilateral attributes) Internal distance (unilateral attributes)
No colonies ties Closed economy
No shared regional trading block Lack of membership in international organisations
Different currency Weak legal institutions
Lack of common legal system Lack of government check and balances
Political hostility Societal conflict
Political/expropriation risk
Source: Ghemawat (2011), p. 55
From the two distances presented, the internal distance allows firms to distinguish the risk when selecting a trading country. Institutional voids are the core explanation from all the aspects presented. Peng et al. (2009) explains the institutional based view as the presence of weak and corrupted institutions in some countries, which affect the development of external firms wanting to invest in those countries.
Chang (2009) contradicts this view by suggesting that if an institution is bribed by a capitalist but invests the money wisely by creating productivity, corruption may not disrupt the economy of a country. In a perfect world, this view may be certain, nevertheless, in a highly greedy society, most of the times corruption does negatively affect the economy of a country.
1.10.4 Economical Distance
Ghemawat suggests that economic size of a country affects the scope of trade. For instance, lack of human, financial and natural resources, as well as, poor infrastructure and distribution force companies to develop different strategies and to undertake different roles for permitting internal growth, as well as, national
growth. In other words, firms in a poor economy differ their strategies radically, in comparison to firms in a developed economy.
Trade is essential for the economic development of a country;; therefore, it is essential for firms in a country to engage with countries that possess low distances. As a result, reducing the risk for firms. However, it is also important for countries, which are underdeveloped, to trade with countries, which can allow knowledge- creation. Ghemawat includes the following factors for measuring economic distance.
Table 3. Economic Distance External distance
(bilateral/plurilateral/ multilateral attributes)
Internal distance (unilateral attributes)
Different consumer incomes Economic size
Human Resources Low per capita income
Natural Resources Low level of monetization
Organisational capabilities Limited resources
Source: Ghemawat (2011), p. 55
The variables explained are essential when projecting maps, which portray other countries according to how essential these are from the viewpoint of the focal country (Ghemawat, 2011). As a result, firms can make strategic decisions about which country to trade with. Additionally, a successful trade can contribute to the competitiveness of a country, consequently, the economic development of a country.
Throughout the literature presented, the economic development of a country is affected by its competitive level or productivity. Similarly, the latter is influenced by individual, institutional, country and firm factors. In terms of the firm, its external environment accelerates and eases its development. Nonetheless, by developing the internal capabilities, firms can influence in the factor creator of a country. Moreover, the explanation about the influence that distances have in the decision-
making of countries provides an overview of how CAGE can be used to contrast countries from a focal perspective. Therefore, focusing only on the necessary information, which is relevant to a specific country.
As a result, the literature helps to clarify the strategic role that firms have for helping to develop the economy of a country, even if there exist market imperfections. It also succeeds in explaining different tools for explaining the factors affecting the development of a country. Further, it also discusses the importance of CAGE distances when contrasting countries. Nevertheless, it fails to answer the specific question about the role that firms have in Ecuador and South Korea. Further, it does not solve the query about whether or not Ecuador can replicate the techniques used by South Korea.
Table 4. Synthesis of main theoretical frameworks from the Literature ROLE OF FIRMS
Authors Data
Country of
Analysis
Approach for
Analysis Key Findings Shenkar et al. 2015 Analysis from past studies United Kingdom Book Country Competitiveness affect economic performance Cuervo- Cazurra et al. 2014 Semi- structured interviews to three government officials, and 14 managers of hotels and travel agencies Costa- Rica Case Study- mapping of multidimensional key events
Firms can take advantage from Location and
develop competitive advantage from it Barney & Mackey, 2016 Composition and analysis of previous research United States Framework development Resource-Based View, firms can create location advantages by developing Firm Specific Advantages Shenkar et al. 2015 Analysis from past studies United Kingdom Book Firm-Level Determinant DISTANCES AFFECTING PERFOMANCE OF COUNTRIES Authors Data Country Approach for
Analysis Key Findings Ghemawat, 2011 World looks from the perspectives of 163 different countries 163 countries Rooted maps CAGE FRAMEWORK Laudon & Laudon, 2016 Collection of past theoretical strudies United Kingdom Book Technology reduces geographical distance Hofstede, 2011 100,000 IBM workforce 50 countries Cross-cultural Studies Differentiates
cultures on the basis of an array of
GLOBE research 17,000 mid- level managers, 100 CEOs and 5,000 senior executives in a variety of industries 24 countries International Research Report
Study of the
relationships among societal culture, leadership and organizational practices Peng et al.
2009 Analysis of previous literature China Perspective Paper approach Institution Based- View
CHAPTER 3: METHODOLOGY
1.11 Introduction
The justification for the process, the reasons for the data selected and the sources of data is explained in this chapter. Consequently, the clarification of the procedures, as well as, the development of a logical structure utilised in this study for answering the proposed research questions, will be achieved.
1.12 Research Purpose
The purpose of this study is to understand which strategic role firms can undertake to boost economic development. In order to achieve it, this study contrasted two different countries. The aspiration is to learn by contrasting success and failure, instead of analysing only success. Therefore, this research investigated the reasons for the success of South Korea, as well as, the explanation for the failure of Ecuador, in terms of firm strategy.
1.13 Methodology
1.13.1 Research Philosophy
In an attempt to understand the situation of the research question, a pragmatic epistemology arose. In other words, the worldview behind this study centres upon the usage of observable phenomena and subjective meanings as valid knowledge for interpreting data. In addition, this is supported by the ontological view, which Saunders et al. (2015) defines as the adoption of multiple perspectives for answering the proposed research question.
1.13.2 Approach
The origin of this study emerged from observing the surprising fact regarding the astonishing development of South Korea, in contrast to, the stagnation of Ecuador, after both countries experienced a similar economic development in 1980. According to Pearse, the abductive approach focuses on the explanation of facts
observed, through the construction of theories (Psillos, 2011). For this reason, abduction was utilised for encountering the reasons behind this situation.
Moreover, Czarniawska (2014) suggests that when utilising a pragmatic philosophy, abduction is useful for covering various perspectives, which may explain the phenomenon studied. Therefore, reassuring the use of abduction for the current research.
1.14 Methodological choice & Time Horizon
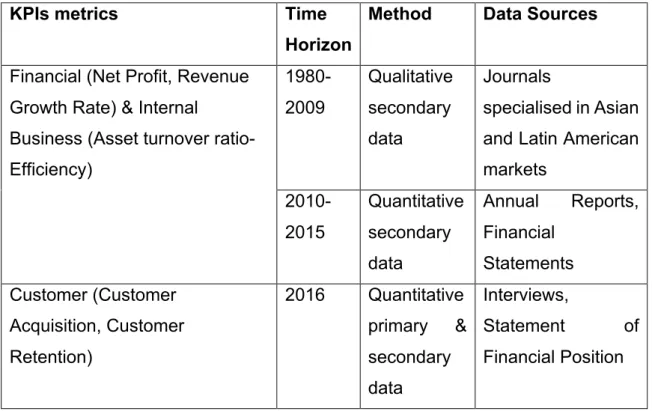
In order to achieve diversity of data, multiple mixed methods were used in the analysis of the Key Performance Indicators (KPIs), as well as, the CAGE analysis. In terms of the KPIs, the following were examined, as seen below.
Table 5. KPIs Methodological Framework KPIs metrics Time
Horizon
Method Data Sources
Financial (Net Profit, Revenue Growth Rate) & Internal
Business (Asset turnover ratio- Efficiency) 1980- 2009 Qualitative secondary data Journals
specialised in Asian and Latin American markets 2010- 2015 Quantitative secondary data Annual Reports, Financial Statements Customer (Customer Acquisition, Customer Retention) 2016 Quantitative primary & secondary data Interviews, Statement of Financial Position
1.14.1 Financial and Efficiency Metrics
In terms of the financial and internal business metric, a longitudinal analysis, which entails data from 1980 to 2009, was obtained through qualitative secondary data. Moreover, from 2010 onwards quantitative secondary data will be collected. This is mainly to achieve triangulation, that is, a broader understanding and stronger interpretation of what is being analysed.
In this specific report, in order to show transparency and reliability of the data used, only financial statements, which followed the IFRS, were used. Further data sources, will be mainly obtained through journals and annual reports respectively.
The currency adopted for portraying the quantitative data is the dollar ($), as it is the international currency used mainly in business. In addition, as this currency is used in Ecuador, this study only needed to exchange one currency;; the Korean Won (KRW). Therefore, maintaining part of the data obtained, as it was encountered. In terms of the exchange rate, in order to express the most exact data, this research adjusted the exchange rate at the year where the financial data was produced, as seen in table 6.
Table 6. Yearly Exchange Rate from Korean Won to US Dollars Year Yearly Exchange Rate
2010 0.0008654 2011 0.0009035 2012 0.0008883 2013 0.0009137 2014 0.0009496 2015 0.0008844
Source: Adapted from Foreign Exchange Services, 2017
In addition, the respective yearly average arithmetic mean was used. This was preferred to geometric mean, as it did not identify the central tendency. On the contrary, it summed all the values of each specific year and calculated a more accurate average.
1.14.2 Customer Metric
Moreover, this metric was acquired from a cross-sectional time horizon, therefore, providing current perspectives and opinions from individuals in the year 2016. This enabled to measure how the other KPIs have affected individuals’ opinions at the current stage.
In terms of South Korea, the data was obtained from the financial reports of each company. However, due to lack of data availability from the Ecuadorian companies, primary research was undertaken. For this, a five-question survey was carried out to 117 people;; 63 females and 54 males, between 25-60 years old living in the two main cities from Ecuador;; Guayaquil and Quito.
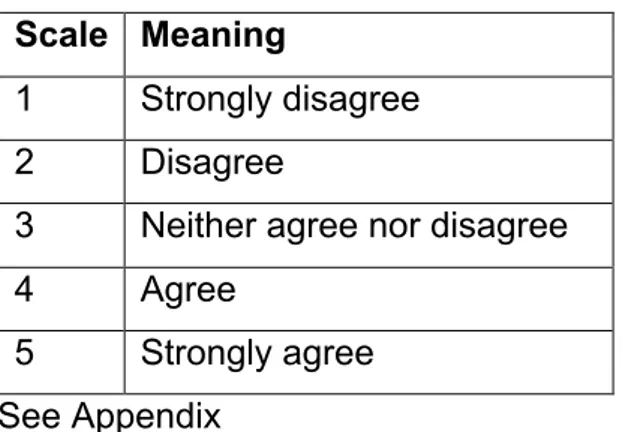
The design of this survey was based on a Likert scale, as it was the most suitable method for acquiring accurate responses (Saunders et al. 2015).
Table 7. Likert Scale Scale Meaning
1 Strongly disagree 2 Disagree
3 Neither agree nor disagree
4 Agree 5 Strongly agree See Appendix
1.14.3 CAGE Distances Analysis
After analysing the KPIs and the strategies of Ecuadorian and South Korean firms, the context of each country was measured from a cross-sectional approach. The aim is to answer the extent to which the strategies of South Korea can be replicated in the current Ecuadorian context. For this, secondary quantitative data was utilised in each component of the CAGE framework. This was mainly obtained from the World Bank, GLOBE database, Ghemawat database, United Nations Commodity Trade Database and World Income Inequality Database. This enabled the comparison and contrast of the distances entailed by both countries. Generally, these explanations aim to be integrated into the theoretical framework discussed in chapter two.
1.15 Strategy
This study contrasts two countries;; Ecuador and South Korea. In order to obtain an understanding of the context from each country, the case study strategy was utilised. The latter was a holistic multiple-case design, which according to Yin, aids in explaining different suggestions for the situation being studied (2015).
Figure 3. Case Study Strategy
Source: Yin, 2015 Context 1: Ecuador Case 1: 5 Ecuadorian firms
Context 2: South Korea
Case 2:
5 South Korean firms
Within this case study, the unit of analysis explored are, firms. These have a high impact on the economy of a country. For instance, firms serve as a seedbed of the economy. In other words, competition is stimulated, and employment is created. As a result, firms can boost economic development despite the existence of market imperfections within a country. Moreover, for each country, there was a case where five firms were evaluated.
Further, firms were selected under the following parameters. Firstly, they needed to provide a high contribution to the Gross National Income (GNI) of the country. In this study, GNI was preferred from other economic indicators as it measures the total income of an economy regardless of whether the income is obtained nationally or from foreign business. In other words, the South Korean companies selected sell internationally, therefore, the Gross Domestic Product (GDP) may be declared elsewhere than South Korea. Nevertheless, by using the GNI it is possible to measure the income made by the companies in that specific country.
Secondly, the selected companies needed to have high revenues in 2015, to contribute to the total GNI of the country (Revenue/Total GNI) and to be created before or on 1980. Consequently, allowing the longitudinal study of the strategies made since that specific point. Generally, the companies seen in Table 7, were elected.
Table 8. Contribution to GNI in 2015 Firms Contribution
to GNI
Revenues* Foundation Operating Sector
Ecuador The Favorita Group 2% 1950 1945 Supermarket chain The Rosado Corporation 1% 1052 1887 Supermarket chain
Pronaca 2% 1133 1936 Food Processor
company Pichincha Bank 1% 1132 1979 Bank National Brewery 1% 503 1906 Brewery South Korea Samsung Electronics 13% 177,365 1938 Electronic company Hyundai
Motors 6% 81,330 1967 Car manufacturer
Posco 4% 55,258 1968 Steelmaking
company
Kia Motors 3% 43,798 1944 Car manufacturer
LG Chem 1% 17,871 1947 Chemicals &
polymers, industrial
materials, IT & electronic
materials *in million US Dollars
Source: Adapted from Hyunday Motors (2015), Kia Motors (2015), LG Chem (2015), National Brewery (2016), Pichincha Bank (2016), Posco (2015), Pronaca (2016), Samsung (2015), The Favorita Group (2016), The Rosado Corporation (2016),World Bank (2016)
1.16 Techniques and Procedure
1.16.1 First Research Question: Strategy of firms
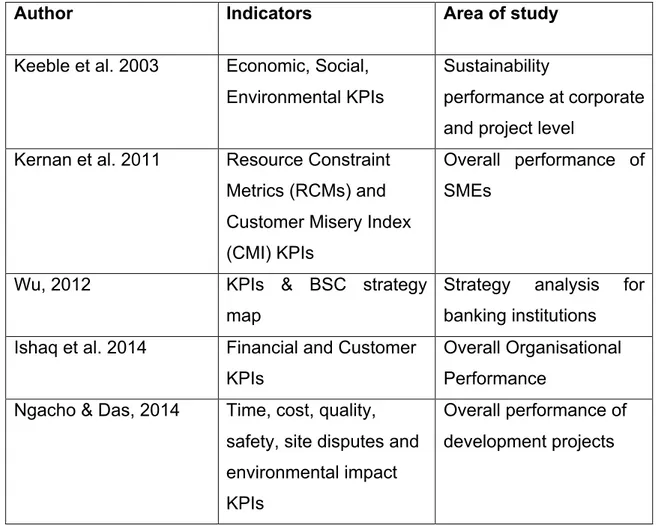
The first research question aims to identify the strategies used by Ecuadorian & South Korean firms. According to this, it was encountered in previous studies the employment of KPIs metrics for analysing firm performance & firm strategy, as seen below.
Table 9. Analytical methods from previous studies Author Indicators
Area of study
Keeble et al. 2003 Economic, Social, Environmental KPIs
Sustainability
performance at corporate and project level
Kernan et al. 2011 Resource Constraint Metrics (RCMs) and Customer Misery Index (CMI) KPIs
Overall performance of SMEs
Wu, 2012 KPIs & BSC strategy map
Strategy analysis for banking institutions Ishaq et al. 2014 Financial and Customer
KPIs
Overall Organisational Performance
Ngacho & Das, 2014 Time, cost, quality, safety, site disputes and environmental impact KPIs
Overall performance of development projects
Within these studies, these techniques were utilised for measuring performance and then linked to the economic development of a country. As seen in the literature, firm-level determinants create productivity, which helps increase the competitiveness of a country, therefore economic development. In order to achieve this, firstly firm-level determinants were analysed through KPIs. According to Shen
(2013), KPIs give a broader view of essential aspects of organisational performance for the success of the organisations analysed.
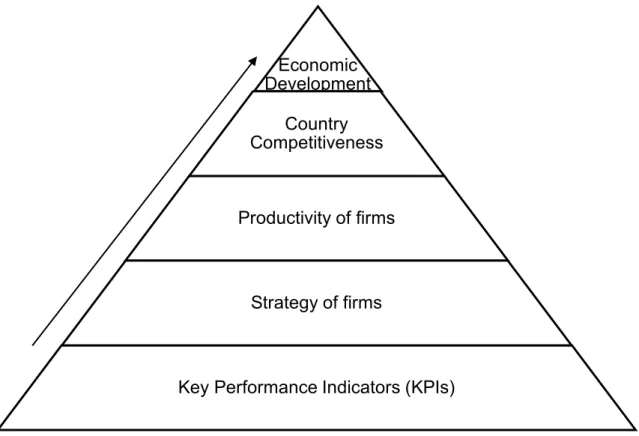
Secondly, the strategies used by these companies were identified. Therefore, enabling the analysis of the firm’s productivity. Thirdly, the impact on the productivity upon the competitiveness and economic development of their country were encountered. Overall, resulting in the following analytical model.
Figure 4. Procedure followed for measuring Economic Development
Overall, as the KPIs vary according to the focus of analysis. Within this research, the indexes and ratios were cautiously selected to specifically understand the differences in performance of Ecuador and South Korea. Consequently, analysing the strategies from each country and pinpointing the effect that these strategies had on the success of South Korea and failure of Ecuador, see Table 10.
Economic Development Country Competitiveness
Productivity of firms
Strategy of firms
Table 10. Metrics used for analysing performance
Ecuadorian Firms South Korean Firms KPIs metrics
The Favorita Group Samsung Electronics Financial (Net Profit, Revenue Growth Rate) The Rosado Corporation Hyundai Motors Customer (Customer
Acquisition, Customer Retention)
Pronaca Posco Internal Business (Asset
turnover ratio -> Efficiency)
Pichincha Bank Kia Motors
National Brewery LG Chem
These metrics were measured through the following formulas.
Table 11. Formulas to measure the KPIs
Financial Metrics Internal Business- Efficiency Metrics
Customer Satisfaction Index (CSI) Metrics
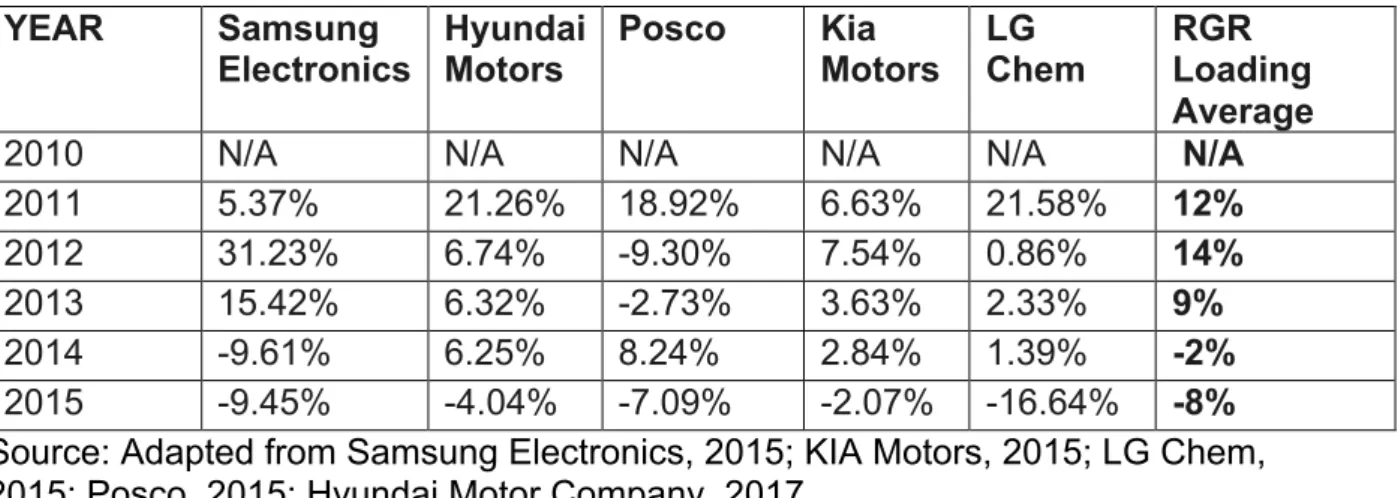
• Revenue Growth Rate Revenue Growth Rate (RGR)= (Year 2 - Year 1)/ Year 1))
RGR Loading Average= (Sum of companies’ revenues in Year 2- Sum of companies’ revenues in Year 2)/ Sum of companies’ revenues in Year 1)
• Net Profit
Percentage Share of Revenue to GNI= (Yearly revenue sum/ Total GNI)
Profit Margin= (Yearly profit sum/ Yearly revenue sum)
Asset turnover ratio= (Yearly revenue/Yearly total assets) (Jones 2013). Ranking from 0 (not satisfied) to 100 (very satisfied)
1.16.2 Second Research Question: Replicability of strategies Moreover, the second research question is answered by using the CAGE distance model. Distances between Ecuador and South Korea were measured to analyse the replicability of the South Korean strategies. Consequently, understanding the extent into which the techniques used by South Korea can be replicated or adapted. Further, the measurements of each component of the CAGE encountered in the literature review were adapted to fulfil the research question.
a. Cultural Distance
Cultural aspects were measured according to the GLOBE model. For this, the following measurement was used.
Table 12. GLOBE scale 1 Very low 2 Low 3 Relatively low 4 Medium 5 Relatively high 6 High 7 Very high
These aimed to situate the level of;; Uncertainty avoidance, Power distance, Institutional collectivism, In-group collectivism, Gender egalitarianism, Assertiveness, Future orientation, Performance orientation, Humane orientation;; according to each country.
b. Administrative Distance
This area was measured by comparing and contrasting data, which identified the Trading bloc, Currency, Legal Institutions, Strength of Institutions from Ecuador and South Korea.
c. Geographic Distance
Physical Distance was the centre of analysis. This is mainly because the study aims to portray the impact that location has in terms of trade.
d. Economic Distance
The economic situation of each country was analysed by measuring the;; Economic size (Total GDP), Consumer incomes (GDP per capita), Income inequality, Availability of natural resources, Rate of unemployment. Consequently, giving a broader view of how the economy could also affect the replication or adaptation of the strategies encountered.
Further, in terms of the software used, firms were mainly analysed through spreadsheets in excel and depicted through charts and graphs, these allowed to give meaning to the data collected. In addition, the use of rooted maps, that is, maps that portray other countries from a focal country was mainly utilised to portray the impact geographic distance had upon trade.
1.17 Research Ethics
The current research follows the code of conduct disposed by Durham University. Firstly, this research does not target any children or vulnerable people, only adults of sound mind over the age of 18 will be included. In addition, in order to safeguard the identity and opinions of the participants involved in the survey, the data will be confidential and will not be given to third parties. In addition, consent was taken to every participant surveyed before the data was utilised in this dissertation. Moreover, the obtained data will be stored and discarded safely. Lastly, every secondary data will be referenced to the according to the author.
1.18 Limitations
One of the key problems from this research relies on the scarce data in some periods. Despite, the use of qualitative, quantitative, primary and secondary data enabled to fill some missing points;; a wider access to data in earlier periods would have enriched the analysis undertaken. However, for the aim of this study, the data obtained meets its purposes. Moreover, as this research is a case study;; the resonance and results of it are limited solely to this case study.
CHAPTER 4: CASE STUDY OF ECUADORIAN AND SOUTH
KOREAN COMPANIES
1.19 Introduction
The analysis of the results obtained from the methodology previously explained will be discussed in this chapter. The following multiple case study was divided into two sections.
Firstly, the Case Study A aims to answer the first research question, that is, ‘Which strategies were used in firms from Ecuador in contrast to South Korea?’ For this, the five Ecuadorian, as well as, South Korean firms were analysed through the following procedure. Firstly, the KPIs selected were synthesised and analysed. Secondly, the strategy was extracted from the KPIs previously examined, and compared between the overall results from both countries. Then, these were related to the extent into which these strategies affected productivity, therefore, economic development.
Secondly, the Case Study B focuses on resolving the second research question. In other words, ‘Can Ecuador replicate the techniques used by South Korea to stimulate rapid growth?’ In order to achieve this, CAGE distances were measured. This considered the degree into which differences between both countries could harm the replication of the strategies used by South Korea.
Lastly, these two results were complemented and enabled to answer the topic being discussed, that is, ‘The role of firms for the economic development of Ecuador in contrast to South Korea’.
1.20 Case Study A: Strategies used in firms from Ecuador in
contrast to South Korea
1.20.1 Case A.1. Key Performance Indicators
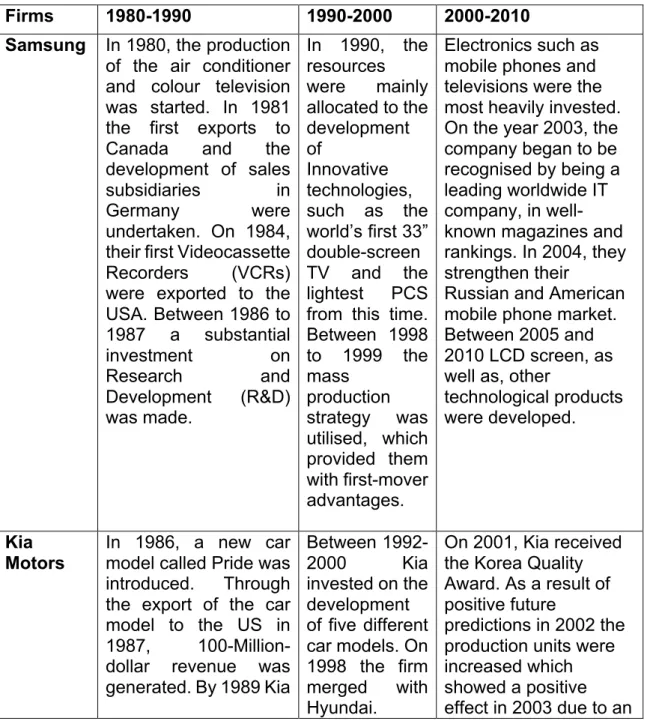
I. Financial, Internal Business and Learning & Growth Metrics: 1980-2010.
Table 13. South Korea: Financial, Internal Business and Learning & Growth Metrics
Firms 1980-1990 1990-2000 2000-2010 Samsung In 1980, the production
of the air conditioner and colour television was started. In 1981 the first exports to Canada and the development of sales subsidiaries in
Germany were
undertaken. On 1984, their first Videocassette Recorders (VCRs) were exported to the USA. Between 1986 to 1987 a substantial investment on Research and Development (R&D) was made. In 1990, the resources were mainly allocated to the development of Innovative technologies, such as the world’s first 33” double-screen TV and the lightest PCS from this time. Between 1998 to 1999 the mass production strategy was utilised, which provided them with first-mover advantages.
Electronics such as mobile phones and televisions were the most heavily invested. On the year 2003, the company began to be recognised by being a leading worldwide IT company, in well- known magazines and rankings. In 2004, they strengthen their
Russian and American mobile phone market. Between 2005 and 2010 LCD screen, as well as, other
technological products were developed.
Kia Motors
In 1986, a new car model called Pride was introduced. Through the export of the car model to the US in 1987, 100-Million- dollar revenue was generated. By 1989 Kia
Between 1992-
2000 Kia
invested on the development of five different car models. On 1998 the firm merged with Hyundai.
On 2001, Kia received the Korea Quality Award. As a result of positive future
predictions in 2002 the production units were increased which showed a positive effect in 2003 due to an
opened a new plant in South Korea.
increase in sales. This same year a new R&D institute was opened. Between 2004-2009 new plants in China were set-up. A better product quality management was implemented. Sales shifted towards more luxurious cars. A focus was set to more environmentally friendly engines.
LG Chem Between 1982 to 1987 four plants were set-up in South Korea. By 1996 India’s Hindustan Polymers was acquired. By 1999 two million global depository receipts were issued and IT and electronic materials were produced.
During this period the expansion through strategic Mergers and Acquisitions (M&A’s) and the setup of more plants were achieved. As well as, the investment of process and product R&D.
Hyundai Motors
Entered the South American market, by exporting the car model Hyundai Pony, through Ecuador. By 1987, the car model Excel was introduced in the US market. In 1989, Excel surpassed one million units of overseas sales.
During 1990 to 1999, the development of a new engine type, the introduction of new car models and a production increase occurred. Between 2001-2006 the company introduced its first diesel hybrid powertrain car was developed and an increase of South American exports was attained. The African and Middle East market
penetration was
initiated and new plants were set-up. On 2007, the cars were adapted according to the regulations of the European market. Between 2009 to 2010 hybrid cars were launched as an