ANALYSIS OF INFLUENCE OF METAL COMPONENTS
MANUFACTURING ON ASSEMBLY
OF REFRIGERATION EQUIPMENT
Edward Michlowicz* and Bożena Zwolińska**
* Department of Mechanical Engineering and Robotics, AGH University of Science and Technology, Krakow, 30-059, Poland, Email: michlowi@agh.edu.pl
** Department of Mechanical Engineering and Robotics, AGH University of Science and Technology, Krakow, 30-059, Poland, Email: bzwol@agh.edu.pl
Abstract. Systemic approach allows to see the production enterprise as a complex system of
production and auxiliary facilities. In process approach, manufacturing makes the stream of materials flow through individual production cells in a mixed (serial – parallel) system, in a discreet way (in steps). Processing times are different at each stage. Element that connects individual production facilities are interoperable landfills, which perform the functions of semis storage departing from object N and magazine of deliveries for the next (N + 1) or another station. Chart flow of deliveries and acceptances at the time takes the stepped form. Parameters of steps depend on the processing time and batch size. In the actual manufacturing process (even in the long term), lines of supply and efficiency do not run parallel. The analyzed plant consists of 9 stations and buffers (warehouses). The process of manufacturing of the refrigeration appliance has a socket structure. An important part of the production is suitable schedule for the preparation of components and assembly.
Paper type: Research Paper Published online: 31 August 2016 Vol. 6, No. 4, pp. 351–360
DOI: 10.21008/j.2083-4950.2016.6.4.7 ISSN 2083-4942 (Print)
ISSN 2083-4950 (Online)
Keywords: production system, production schedule, sheet processing
1. INTRODUCTION
The common element that combines different approaches to production logistics is property flows. Hence, new concepts and tasks of production logistics arise. As a way to eliminate waste (muda) (Womack & Jones, 2008) recommend the lean approach (lean thinking) by creating a stream of values in the enterprise. In the lean approach, one has to go outside the company in order to look at all the actions that make up the process of developing and producing a particular product. According to many authors lean may be defined most simply as a process of continuous elimi-nation of waste. Access to large spaces leads to the accumulation of large stocks, which leads to the generation of excess manufacturing in the course of Work in Process – WiP (Lödding, 2013). In the terms proposed by Rother (2007), the most important task in manufacturing systems is the maintenance of continuity in the flow of materials, as well as the constant improvement (kaizen) of continuity. In relation to supply chains, Nyhuis (2009) state that the primary purpose of produc-tion logistics can be determined by the ability to increase supply and the reliability of supply at the lowest possible cost of logistics and production. Currently, there are many methods and techniques that can be used in the production-related activi-ties of the enterprise. All customized solutions that contribute to improving the productivity of manufacturing processes may be of help here. For analysis of the correctness of material flow in production processes, Nyhuis and Wiendhal pro-posed nine basic laws of production logistics (9 LPL). In several laws WIP is an important element of the dependence of production. Work in Process (WIP) is that part of a manufacturer's inventory that is in the production process and has not yet been completed and transferred to the finished goods inventory. This account con-tains the cost of the direct material, direct labor, and factory overhead placed into the products on the factory floor.
2. THE PROBLEM OF WIP IN THE PRODUCTION OF
REFRIGERATION EQUIPMENT
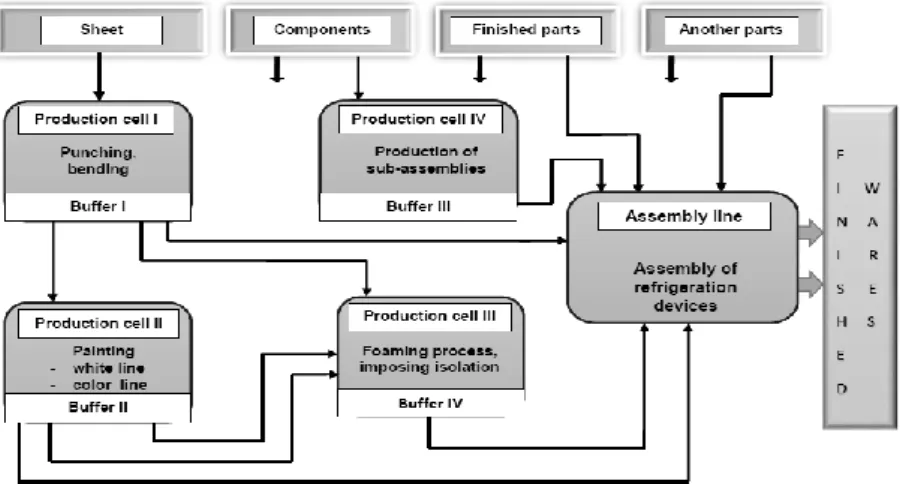
The analyzed plant consists of 9 stations and buffers (warehouses). These buf-fers are arranged between groups of machines run the same technological operations. The material input is plate in coils supplied in a given quantity to store the input as change (480 minutes) in the case of painted sheet or two changes (960 minutes) for the other plates. Coils sheets are taken to a first station where they are cut into
sheets of different lengths. The dimensions of the sheets cut from one circle depends on the type of cut sheet. Done sheet metals are stored in buffers (every type of sheet in a separate buffer), where you get to shearing. After cutting the sheet set number of elements of a suitable size, they are deposited on a pallet arranged in the vicinity of equipment in different places of the hall. The next stage of the production process is the bending of the cut-out sheet in order to obtain the desired shape. Thus prepared items are stored in a warehouse for semi-finished products, where it is tran-sported to painting, foaming or assembly hall. The block diagram of the production process is shown in Figure 1.
Fig. 1. Scheme of production system
The following are dependencies to minimize the duration of the production task. The flow of materials through the production stations and buffers can be formu-lated as follows (Tab. 1 and Figs. 2, 3). If the values describing logistics processes are according to Tab. 1, then the delivery moment of the k batch of material from point i to point j is given by the formula:
• shipment moment of the k batch of material from point i to point j:
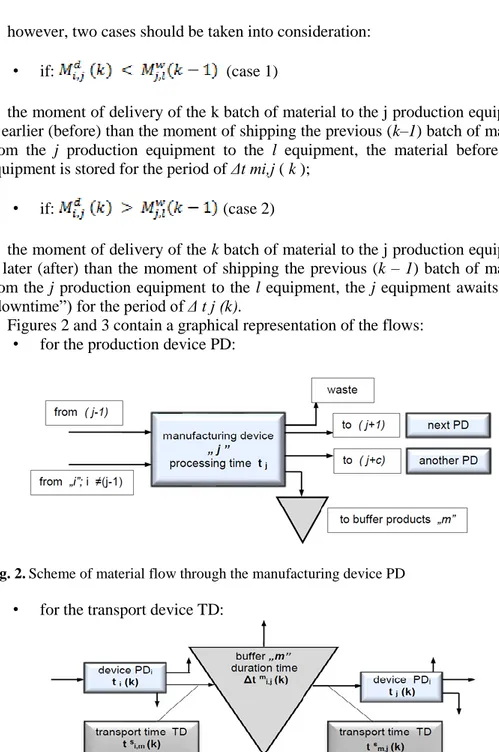
however, two cases should be taken into consideration: • if: (case 1)
the moment of delivery of the k batch of material to the j production equipment is earlier (before) than the moment of shipping the previous (k–1) batch of material from the j production equipment to the l equipment, the material before the j equipment is stored for the period of Δt mi,j ( k );
• if: (case 2)
the moment of delivery of the k batch of material to the j production equipment is later (after) than the moment of shipping the previous (k – 1) batch of material from the j production equipment to the l equipment, the j equipment awaits (is in “downtime”) for the period of Δ t j (k).
Figures 2 and 3 contain a graphical representation of the flows: • for the production device PD:
Fig. 2. Scheme of material flow through the manufacturing device PD
• for the transport device TD:
Table 1. Process-describing values designation Value
designation
Value Description
i, j = 1, 2, …n consecutive numbers of production equipment UP,
i.e. (i UP, j UP)
k = 1, 2, …p batch number of the material MT, (k MT)
s = 1, 2, … st consecutive numbers of transport equipment UT, (s UT)
m = 1, 2, … ma warehouse number MA, (m MA)
Mwi,j (k) shipment moment of the k batch of material from point i to point j
Mdi,j (k) delivery moment of the k batch of material from point i to point j
t si,j (k) total time of transport cycles (loading, transport, unloading, return) of the k batch of materials, with transport means s from point i to point j
Δt m
i,j (k) time spent by the k batch of material at warehouse m, between points i and j
tj (k) time of the k batch of material crossing the point j (time of k batch service on equipment j)
t pj ( a ) time of conversion of the j equipment for the production of (a) products
2.1. Process in Production cell I – preparation of elements of steel sheets
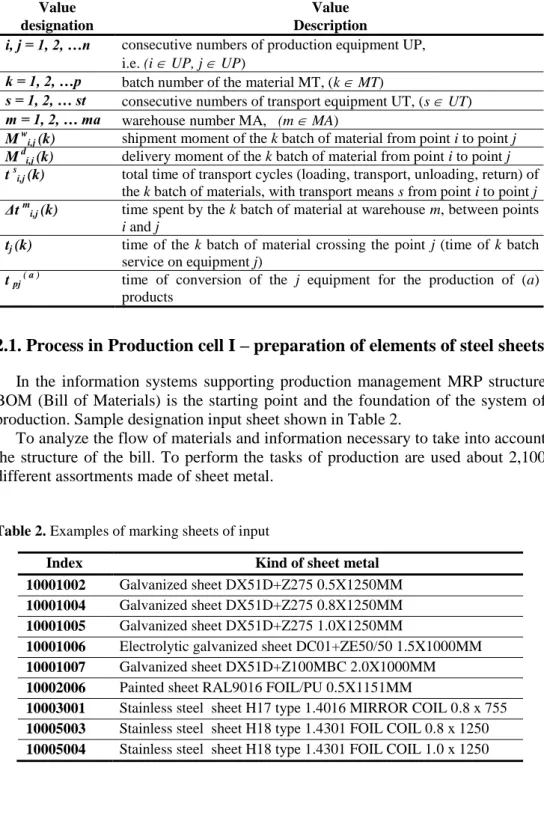
In the information systems supporting production management MRP structure BOM (Bill of Materials) is the starting point and the foundation of the system of production. Sample designation input sheet shown in Table 2.
To analyze the flow of materials and information necessary to take into account the structure of the bill. To perform the tasks of production are used about 2,100 different assortments made of sheet metal.
Table 2. Examples of marking sheets of input
Index Kind of sheet metal
10001002 Galvanized sheet DX51D+Z275 0.5X1250MM 10001004 Galvanized sheet DX51D+Z275 0.8X1250MM 10001005 Galvanized sheet DX51D+Z275 1.0X1250MM
10001006 Electrolytic galvanized sheet DC01+ZE50/50 1.5X1000MM 10001007 Galvanized sheet DX51D+Z100MBC 2.0X1000MM 10002006 Painted sheet RAL9016 FOIL/PU 0.5X1151MM
10003001 Stainless steel sheet H17 type 1.4016 MIRROR COIL 0.8 x 755 10005003 Stainless steel sheet H18 type 1.4301 FOIL COIL 0.8 x 1250 10005004 Stainless steel sheet H18 type 1.4301 FOIL COIL 1.0 x 1250
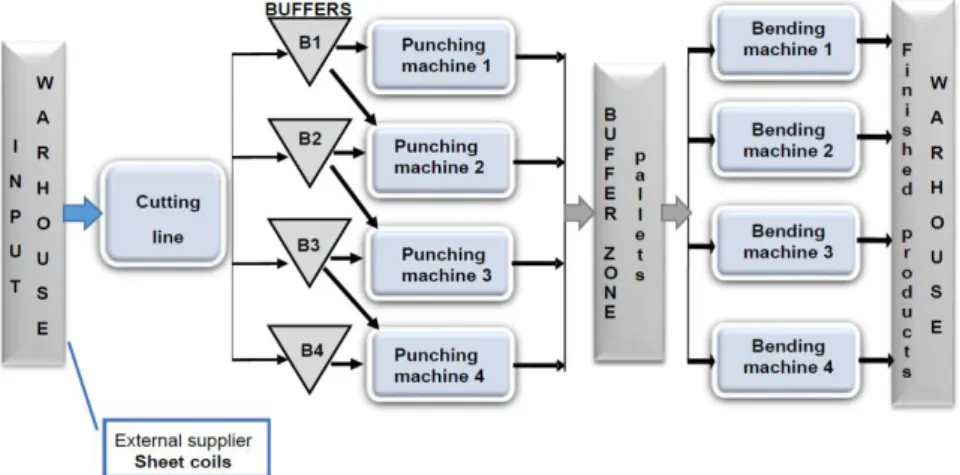
Figure 4 shows the basic processes and equipment for the production of these elements.
Fig. 4. The structure of the technological process
Figure 5 shows an example of linking a list of elements of the bill BOM with the process and specific device.
Laser Bending 97-01-0000608_1szt._1.10.1
00:09:12 00:03:54 00:00:38 00:13:44
Laser Bending 97-01-0000609_1szt._1.10.2
00:09:12 00:03:18 00:00:42 00:13:12
Laser Bending Welding Pickling 97-01-0000611_1szt._1.10.3
00:24:12 00:16:25 00:02:30 00:02:15 00:01:36 00:02:01 00:14:39 01:03:38 Laser Bending 97-01-0000612_1szt._1.10.4 00:08:22 00:05:40 00:01:17 00:15:19 Cutting 97-01-0000492_5szt._1.10.5 forming 00:03:49 00:02:10 00:14:39 bending Pulmax Punching 97-01-0000652_1szt._1.10.6 00:02:54 00:00:25 00:02:01 00:00:37 00:05:57 Pulmax Punching 97-01-0000654_1szt._1.10.7 00:03:12 00:00:45 00:02:51 00:00:42 00:07:30 Pulmax Punching 97-01-0000653_16szt._1.10.8 00:02:13 00:05:36 00:02:44 00:04:00 02:32:57 Cutting 97-01-0000491_2szt._1.10.9 00:03:12 00:00:52 00:04:56
Fig. 5. Example of linking a list of elements of the bill BOM
For each station on the production line has been analyzing states. Data on the volume of production, range of plates, durations of technological operations,
possi-ble device failures obtained from the actual object. Many of the size have been described by functions of probability.
For example, number of items on the exit of the punching machine 1000_1 is described gamma distribution, and number of items on the exit of punching 1000_2 is described triangular distribution. Cycle times for each bending machine are de-scribed using a normal distribution. Conversion folding involves changing the bending radius sheet by exchanging the upper and lower strips profiling and adjust the clearance between the slats bending. Frequency setting (set-up) bending ma-chine is described a normal distribution. Time between failure for each bending machine is described using a normal distribution.
After working on punch and bending machines elements of the sheet goes to the warehouse of finished parts, where depending on demand are transported to paint-ing, foaming or straight to the assembly hall.
2.2. Schedule - preparing the maps of the whole manufacturing process
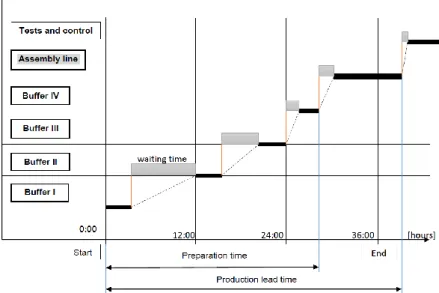
Figure 6 shows the theoretical schedule of pre-production, final assembly and quality control.
Fig. 6. Theoretical production schedule
For reliable reflecting of the system work parameters in Witness simulator, the following data had to be gathered: work cycle time, preparing and finishing time, rearming time, defects, breakdown and downtime time, network time for each shift, and average time for cleaning the station and preparing of the documentation and reports (Zwolinska, 2015). Regarding the big variety of production components it
was significant to determine the parameters of station effectiveness. For instance, during one shift on the trimming stage around 2 000 intermediate products are be-ing produced from different types of sheets measurbe-ing from few centimetres to four meters. The variety of dimensions had a major impact on the above listed times. Given such wide range of parameters (types, quantity and times) a number of vari-ables defined by various probability distributions were used. Data gathered over one month was the base of the analysis that led to choosing of the distribution.
The scheduled rearming time has been determined after the analysis of all re-arming times recorded within a specific period of time. A list of the sums of all rearming times has been shown in the Fig. 7.
Fig. 7. Summary of retooling times during the observation period
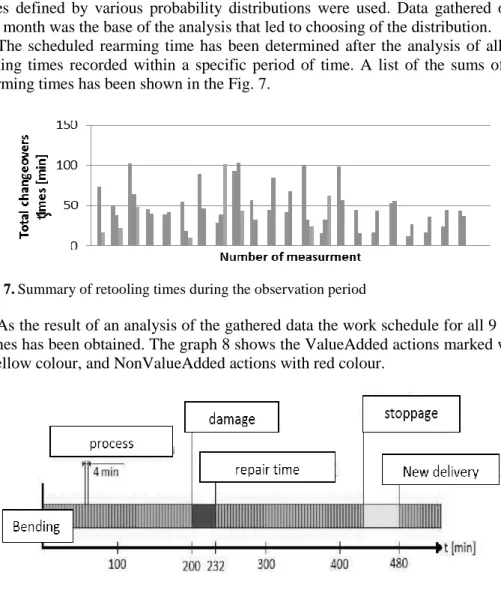
As the result of an analysis of the gathered data the work schedule for all 9 ma-chines has been obtained. The graph 8 shows the ValueAdded actions marked with a yellow colour, and NonValueAdded actions with red colour.
Fig. 8. The schedule of working time, damages and stoppages of workstation
In the Witness model the cycle time and number of manufactured sheets on each station have been represented by variables. The values of variables differ de-pending on the type of cut metal sheets, length and width of the sheet, quantity and complexity of manufactured products. Time cycles described by variables (e.g. x1,
y1) are not given plain but by distributions. The result of using variables dependent on the input parameters of material and on probability distributions for operating times, times for breakdowns, downtimes, repairs etc. for all 9 machines is the mod-el that includes many different work statuses.
3. CONCLUSION
The main purpose of conducted analyses is to minimise the lead time from the moment of the input to the considered subsystem to the output. Additional assump-tion is to decrease the overproducassump-tion both on the level of cutting the metal sheets and the overproduction occurring between the punching machine and the press brake. The second goal is to maximise the utilisation of machine operating time, and to reduce the rearming and repair times. The limitation resulting from the company's demand for metal parts is the minimum production capacity of 2000 final elements per shift. The above specified condition has to be met when applying any modifi-cations.
The number of coils delivered from the input warehouse to the start of produc-tion line differs depending on the type of the metal sheet. Too big stocks of mate-rial cause very rapid infill of the warehouse space behind the cutting station and the necessity to store the materials for a long time. To avoid storing of big amounts of metal sheets in the beginning of the production process the stock of coils has been reduced and standardised to 4 coils every 3 shifts.
Along with the reduction of the number of punching machines, the input queuing system on pressing stations is changed. After the adjustment, the analysed production line manufactures 2290 final elements per shift, thus meeting the minimal required units of 2000 per shift with a minor excess. Additionally, the general efficiency of the production system is sustained without blocking the sta-tions caused by overfilling the buffers.
ACKNOWLEDGEMENTS
This work was supported funded by research project AGH University of Science and Technology 11.11.130.965.
REFERENCES
Womack J.P. & Jones D.T. (2008), Lean thinking. Banish waste and create wealth in your corporation, ProdPress.com, Wroclaw.
Lödding H. (2013), Handbook of Manufacturing Control. Fundamentals, Description, Configuration, Springer-Verlag, Berlin Heidelberg.
Rother M. & Harris J. (2007), Creating Continuous Flow, Lean Enterprise Institut Poland, Wroclaw.
Nyhuis P. & Wiendhal H.P. (2009), Fundamentals of Production Logistics. Theory, Tools and Applications, Springer-Verlag: Berlin Heidelberg.
Michlowicz E., Smolińska K. & Zwolińska B. (2015), Logistics engineering in a produc-tion company, Research in Logistics & Producproduc-tion, Vol. 5, No. 5, pp. 503–513. Michlowicz E., Smolińska K. & Zwolińska B. (2015), Impact of work in process on the
level of interoperable stocks, Conference Proceedings Carpathian Logistics Con-gress 2015, TANGER, Jesenik, Czech Rep., pp. 133–138.
Michlowicz E. & Smolińska K. (2015), The impact of modernization on the productivity of a multi-stage production of transformer sheets, Conference Proceedings of 24th International Conference on Metallurgy and Materials METAL 2015, TANGER, Brno, Czech Rep., pp. 1720–1726.
Zwolińska B. & Smolińska K. (2015), Use of Witness simulation for improving the continuity of the flow, Conference Proceedings Carpathian Logistics Congress 2015, TANGER, Jesenik, Czech Rep., pp. 485–490.