GRANULARITY DEPENDENCY OF FORECAST
ACCURACY IN SEMICONDUCTOR INDUSTRY
Holly Claudia Ott*, Stefan Heilmayer** and Cindy Sng Sin Yee***
* Logistics & Supply Chain Management, UniSIM – SIM University, Singapore, 599491, Singapore, Email: hollyott001@unisim.edu.sg
** Supply Chain, Infineon Technologies Asia Pacific Pte Ltd, Singapore, 349282, Singapore, Email: stefan.heilmayer@infineon.com
*** Logistics & Supply Chain Management, UniSIM – SIM University, Singapore, 599491, Singapore, Email: cindysngsy@gmail.com
Abstract Accurate demand forecasting is critical in the semiconductor industry due to high production costs, long lead times, and high market volatility. To remain competitive, companies strive for accurate forecasts to drive their planning cycles and meet customer demand. Although an orga-nisation may not be able to control the accuracy of forecast received due to externalities, they can define the granularity which is most suited to the purpose of the forecasting. Infineon Technologies uses different product granularities for the sales and marketing forecast, for the operational demand forecast and for the monthly volume rolling forecast (VRFC). The latter is the subject of this work. This paper presents the impact of forecast granularity for the VRFC on the accuracy of the plan and checks the dependency of this forecast accuracy on time over the entire planning horizon. Sources of inaccuracies were also identified through discussion with the company experts. The results of this study indicate that granularities and time do have significant impact over the plan accuracy.
Paper type: Research paper Published online: 10 January 2013 Vol. 3, No. 1, pp. 49-58
ISSN 2083-4942 (Print) ISSN 2083-4950 (Online)
Keywords: Semiconductor, forecast accuracy, granularity, planning, Infineon Technolo-gies, UniSIM
1. INTRODUCTION
To cope with high demand volatility, the semiconductor industry today has experienced a surge in chip production outsourcing in order to increase production flexibility. The industry has witnessed a proliferation of products with increasingly shorter lifecycles, as consumers demand the latest technological advancements from this highly competitive market. Forecast data is used to plan capacity and place orders for raw materials in preparation of the actual production. This is espe-cially important in the semiconductor industry where the manufacturing lead-time (months) is much longer than customers’ order lead-time (weeks). When planning numbers are too low, there could be insufficient materials for production, causing customers dissatisfaction as orders are delivered late or loss of revenue. On the other hand, when the planning numbers are too high, the result could be unneces-sary capacity investments and excess orders for raw materials. Inaccurate forecasts have prevented companies from planning and aligning their resources to the opti-mum level, resulting in higher inventory levels or unfulfilled or late orders.
This project examines the forecast data of a global semi-conductor company, Infineon Technologies. We measure the forecast accuracy in the assembly opera-tions of a particular segment in Infineon Technologies in order to evaluate the im-pact that different granularities have on forecasts accuracy over time and on the identification of possible sources of inaccuracy for future improvement.
2. RESEARCH BACKGROUND & METHODOLOGY
2.1. Literature Review
iCognitive (2010) has conducted a study involving fifty two multi-national semiconductor companies worldwide with at least USD$400million turnover per annum. The outcome has revealed that the top concern from the industry is demand forecasting accuracy. The volatility of semiconductor industry is well-known and forecast inaccuracy can stem from many different external factors which cannot be controlled by an organization. One of the factors is the bullwhip effect, or the am-plifying of the demand signal along the supply chain. Today’s a short product life-cycles and steep product ramps are also the main causes of the unpredictability in future customer demand in the semiconductor industry.
Whalen (2004) emphasized the use of Information Technology (IT) to increase agility in responding to the volatility in the semi-conductor supply chain and to attain the challenges as follows:
• Improving predictability and velocity of demand signals
• Leveraging demand variability and improving customer service levels • Using die-bank strategies for maximizing supply chain responsiveness • Sustaining lead-time reduction while reducing inventory
• Integrating shop floor execution for global visibility • Achieving accurate supply and demand picture.
Weng (1999) completed a study on product pooling through product modularity and demonstrated that demand uncertainty of multiple products can be mitigated by sharing same product modularity between distribution centre and retailers. Same modular product design allows management the chance of using the most capable product, which is also the most expensive, as joint buffer stock to substitute for other products when a stockout occurs at a retailer. He compared the retailers that employed the system and retailers that did not use it. Results showed that retailers that used such pooling schemes enjoyed substantial inventory costs savings and also heightens customers’ satisfaction levels as it enables diverse degree of varia-nce of products to the customers.
2.2. Granularity
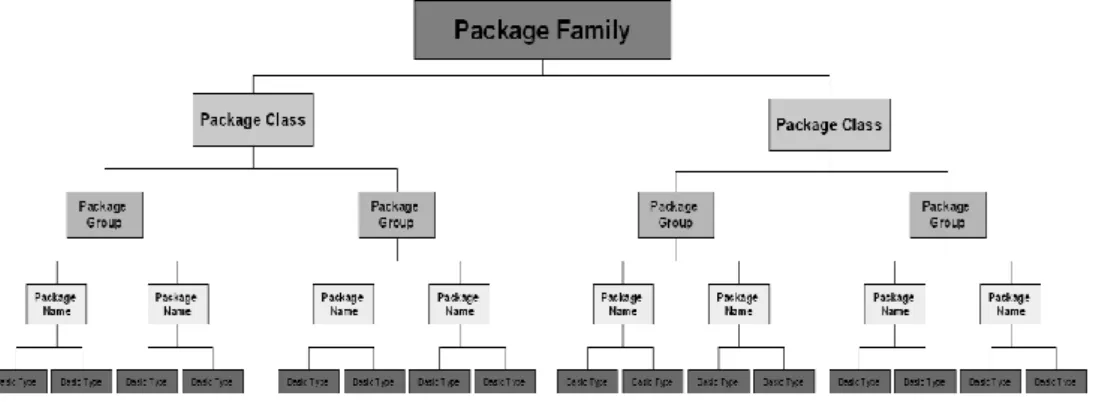
Granularities mean the levels (or tiers) of package for each product Infineon tiers their product packages to four main granularities: Package Family, Package Class, Package Group and Package Name. Packages are grouped into package families based on their way of final package which determines their final assembly flow. Package family has the highest granularity while package name has the lowest granularity. The basic type represents the chip itself, which can be assembled in various packages, and is thus another granularity beneath the package name.
Table 1 Number of data points for each granularity in the study
A B C D E
Basic Type Package Name Package Group Package Class Package family 3394 422 174 35 16
The granularities used for this study and the number of data points are shown in Table 1. Calculation of the forecast accuracy is done on these different granularities and on its corresponding quarters to the target month. The target month used was July 2011. Analysis was done on every quarter of 18months backdated from the target month. The alphabetic notation in Table 1 represents each granularity which was used in the analysis.
2.3.
Volume Rolling Forecast (VRFC)The Volume Rolling Forecast (VRFC) is Infineon’s centralized, mid-term sup-ply planning process, which is based on matching the demand planning to that of capacity planning. This is a periodical (monthly) re-planning of the volume of pro-duction based on the forecast on a rolling horizon where previous forecasts are updated and the next forecast is added to this horizon. This mitigates market uncer-tainties that cause the planning numbers to deviate from actual production.
2.4.
Symmetrical Mean Absolute Percentage Error (SMAPE 3)Symmetrical Mean Absolute Percentage Error (SMAPE 3) is used to analyse the accuracy on the impact of granularities and dependency on time. This error measurement tool is protected against distortion caused by low data values. This is done by calculating the error for each SKU then averaging this error, SMAPE3 uses a summation of both the Negative Error and the Positive Error, in order to identify any potential bias towards under- or over-forecasting.
SMAPE 3 =
Where O = Orders or Back End Deliveries*, F=forecast or sales forecast .
Using the SMAPE 3 results, the level of accuracy at Infineon is calculated by
2.5. Accuracy Findings and Impact of Change in Granularity
From Figure 2 below, it is clear that as the granularity moves higher (from Basic Type to Package Family), the accuracy increases. While the overall accuracies of the four upper granularities show smaller differences, the accuracy gap in the basic type is unmistakably biggest gap compared to the rest of the granularities.
Fig. 2 Granularity Total Accuracy Findings based on SMAPE 3
To determine if the impact of change in granularity affects the accuracy, it is necessary to find a ‘change factor’(using the number of data points) between each granularity. The above shows the change factor between one granularity to the next. The basic type and package name have the highest difference in the change factor. This table for the change factor was also rearranged in descending order from left to right. Hence, package group and package class have the next highest change factors even though they belong to the higher level of granularity.
Table 2 Change Factors of Granularity
△ in No. A-B C-D B-C D-E
Table 3 Effects of Granularity Change
Granularity Change A-B C-D B-C D-E
Factor 8.04 4.97 2.43 2.19 VRFC1104 0.21 0.06 0.08 0.01 VRFC1101 0.32 0.06 0.03 0.00 VRFC1010 0.36 0.08 0.06 0.01 VRFC1007 0.39 0.09 0.06 0.03 VRFC1004 0.36 0.14 0.06 0.03 VRFC1001 0.40 0.09 0.03 0.00 Average 0.34 0.09 0.05 0.01
Formula : 1-(Granularity Forecast Accuracy% / next relative granularity Forecast Accuracy %)
The results in Table 3 are derived by the above formula. This table shows that as the change factor gets smaller, so does the change of accuracy where the largest change in accuracy is closest to 1 (indicating maximum effect on the forecast accuracy), while the smallest change in accuracy is closest to 0 (which indicates effect on the forecast accuracy). It is clear that the highest factor of change has the biggest impact to the accuracy level while the lowest factor is close to 0, thereby, showing that it has minimal effect on the change of accuracy.
Fig. 3 Exponential results on factor of change in numbers of data for each granularity Outlier
Figure 3 is plotted based on the data from Table 3. Exponential curves are fitted to the points showing that there is an exponential relationship between factor and accuracy gain. These curves show that the apparent correlation between the factor of change and the impact it has. The outlier found will be further explained in the section 2.5.
2.6. Dependency Of Forecast Accuracy Over Time
The next analysis demonstrates that granularities’ forecast accuracies increase as the VRFC timeframe approaches the final demand date. The actual data only shows up to VRFC1104 which data for the last three months (15th month) before the final demand date (18th month). Hence, the 18th month, the final demand month, is assumed to have an accuracy of 100%. The average and median results below proves again that the lowest granularity (Basic Type) has the lowest accuracy, and accuracy improves as it moves upward to the highest granularity (Package Family).
Table 4 Time series of forecast accuracy Month Basic Type Package
Name Package Group Package Class Package family 18 100.0% 100.0% 100.0% 100.0% 100.0% 15 63.1% 80.4% 87.4% 93.2% 94.2% 12 55.2% 81.6% 84.6% 90.0% 90.4% 9 50.0% 78.2% 82.7% 89.9% 90.7% 6 47.5% 77.8% 82.5% 90.7% 93.2% 3 45.2% 70.4% 74.8% 86.8% 89.6% 0 40.6% 67.7% 69.9% 76.6% 76.9% Average 57.37% 79.44% 83.13% 89.60% 90.71% Median 50.00% 78.20% 82.70% 90.00% 90.70%
A fitted lines plotted in Figure 4 shows a linear correlation between the forecast accuracy and the age of the forecast, validating that the forecast accuracy increases as the forecast gets nearer to the final demand date. This figure also shows that change in granularity causes change accuracy.
Fig. 4 Linear results on forecast accuracy in relation to time dependency
2.7. Possible Sources of Inaccuracy
Interviews on the sources of inaccuracy with experts from the planning team for power segment in Infineon Technologies revealed three types of possible causes:
• “Positive thinking” bias: this would give the “hockey stick” characte-ristics effect on the graph. This is usually due to human presumptions of overestimating volume of production by emotions. As time goes by when the expected orders did not come true, it in turn brings about the “Negative Thinking” bias.
• Management contradiction: this is the next attributing factor. Mana-gement stresses on both turn over and planning accuracy. These two targets may be manipulated but cannot be fulfilled at the same time. Contradic-tions as such will most likely jeopardise the overall accuracy.
• Economic planning: Due to time constraints and effort limitations, planners of sales, marketing and production, are often instructed to only work on the representative products (such as top 20 products) following to a Pareto analysis (80-20 rule) instead of all products. Thus, the accuracy of the other products could also reduce the overall accuracy.
These interviews also clarified that the outlier identified in Figure 3 was due to package name PG-TDSON-8-14. Figure 6 is a screenshot of the raw data. The highlighted area shows that for this package, there were no demand forecasted except for VRFC 1104 causing sudden surge in demand. This was because it was
A-B 8.07 (0.34) B-C 2.43 (0.09) C-D 4.97 (0.05) D-E 2.19 (0.01 )
a newly created package and after the first demand planning, there was a delay in the release of the package due to some unresolved quality issues. This resulted in the removal of the data after VRFC1104, causing the forecast inaccuracy to spike.
Fig. 5 Cause of Outlier in Fig 3
3. CONCLUSION
This paper justified the necessity of using an effective and efficient way of forecasting for semi-conductor companies with large numbers of products by leveraging on this concept of granularities together with a volume rolling forecast.
Both objectives of this study to measure and quantify the effect of product granularity and forecast time on forecast accuracy were met. As we would expect from pooling theory, it is clear that the highest granularity (Package Family) has the highest overall accuracy. The study also showed that the granularity increases, the accuracy also increases. Mathematically, it has also shown that the changes in the number of data points in each granularity do impact to the accuracy of the forecast. The largest change factor between two granularities has the highest average that is closest to 1 represents a high change in accuracy while the vice versa is also true. The smallest change factor has the smallest change in accuracy, a figure that is closest to 0 indicating minimal impact on forecast accuracy.
Another fact is established from this study was that as time approaches the final demand month, forecast accuracy becomes higher. This is as expected, as there should be more accurate information available, as well as more accurate stock information. The study showed that for every granularity its accuracy increases consistently as the “forecast age” increases (nearer to the actual production month). These findings are essential as it justifies that granularity used for planning should reflect the tasks aligned to accomplish within time frame. This means the
right granularity should be used at the right time frame for the most accurate
planning results. Semi-conductor manufacturing companies with large product range can also utilise this concept to achieve the optimal planning results.
ACKNOWLEDGEMENTS
The authors gratefully acknowledge sponsors, UniSIM – SIM University & Infineon Tecnologies Asia , for making the publication of this research possible.
REFERENCES
Kremers,L (2011), 2010 State of Supply Chain Performance in Semiconductor Industry, iCognitive.
Z. Kevin Weng., (1999), Risk-pooling over demand uncertainty in the presence of product Modularity, http://www.sciencedirect.com/science/article/pii/S0925527398002266 (accessed 29 October 2011).
Whalen, M. (2004), Responding to Volatility in the Semiconductor Supply Chain, IDC, www.oracle.com, (accessed 8 August 2011).
BIOGRAPHICAL NOTES
Holly Claudia OTT holds a Ph.D. in Electrical Engineering and has worked for
twelve years in semiconductor production in the USA, Europe and Asia for JVs with Siemens, Motorola, IBM and Infineon. Currently, Holly is a senior lecturer of Operations and Supply Chain Management in the School of Management at the Technical University of Munich and is an adjunct professor at Singapore Management University and an associate faculty at SIM University. Her research interests include operational incentive alignment and communication in global, cross-matrix organisations.
Stefan Heilmayer, holds a degree in Computer Science from the Technical
University Munich. He is Senior Specialist in Supply Chain (SC) at Infineon Tech-nologies in the area of SC innovation. He has led a two years research project in Singapore (Semiconductor Supply Chain Science Center) in cooperation with national universities.
Cindy Sng Sin Yee, who is proficient in English, Chinese and Japanese, holds
a degree in Logistics and Supply Chain Management from UniSIM - SIM University. Her final project was noted amongst top six in school for the past two years and was presented to Singapore’s prime minister Mr Lee Hsien Loong in August 2012. She is currently working at Ryosho Techno, a Japanese semi-conductor distributor and is active in the Global Supply Chain Council.