STRATEGY OF IMPROVING RESISTANCE OF SUPPLY
CHAIN IN CONDITIONS OF DISRUPTIONS
Włodzimierz Kramarz* and Marzena Kramarz*
* Department of Organization and Management, Silesian University of
Technology, Akademicka 2A, 44-100 Gliwice, Poland,
Email: wkramarz@op.pl,
Email: mkramarz@polsl.pl
Abstract The resistance of network supply chains to disruptions is the very important exploratory
area. Moreover, from the perspective of individual chain links forming a network supply chain, an essential issue is the skill of adapting itself to variable conditions of the environment and changes in the structure of the chain itself. The article took into consideration both of the exploratory areas: the resistance of network supply chains to disruptions and adaptive strategies of chain links in a supply chain.
Paper type: Research Paper Published online: 31 January 2015 Vol. 5, No. 1, pp. 53-63
ISSN 2083-4942 (Print) ISSN 2083-4950 (Online)
© 2015 Poznan University of Technology. All rights reserved. Keywords: strategy, resistance, disruptions
1. INTRODUCTION
Strategies of enterprises directed on: growth of the adaptation to changing envi-ronmental conditions as well as improving the resistance of the supply chain, usu-ally include widening the potential of the organization through the structure of network relations. Therefore currently the majority of supply chains has a network structure. Network supply chain was defined as a structure of flows be-tween all enterprises cooperating in production and supply of products, from sup-plying materials to consumption of final products, where one can perceive different relations between participants. Janssen M., Feenstra R. (2010) supplement this interpretation with the statement that organizations are often parts of many differ-ent supply chains. Production systems originally designed as a result of product and technological innovations require new business partners. Consequently, it is becoming more adequate to use the notion of ”a business network” or "a network supply chain”. This is an attempt to proceed from the static conception of a supply chain towards a dynamic look at the system of cooperating organizations.
Such a perspective is compatible with to the arrangement of content presented in the paper, with the presented structure of cooperating enterprises and with selec-tion of the research methodology. The aim of the presented research was to indicate an opportunity to increase the resistance of a supply chain to disruptions. In order to achieve it, part 2 discusses the category of the resistance of a supply chain and indicates the issue of subcontracting in network supply chains and indicated differ-ent types of disruptions in material flows in the context of collaboration of differ- enter-prises in network supply chains. Mentioned categories of disruptions were analysed in the chosen link of the supply chain of the automotive industry (part 3). Results of those empirical examinations partly were discussed at the Carpathian Logistics Con-gress (Kramarz & Kramarz, 2012). Part 4 presented the results of simulation experi-ments based on the model of a network supply chain with subcontracting as exemplified by selected nodes cooperating in the area of production of details and components in the automotive industry. The main aim of the research was to indicate such an strategy of material decoupling point in a supply chain of the automotive industry as regards production capacities, in the conditions of variable demand which will not be a factor arousing and / or strengthening supply chain disruptions.
2. DETERMINANTS OF RESISTANCE
and the structure of the supply chain. The force of disruptions as well as the struc-ture of the supply chain and strategies of chain links influence deviations in materi-al flows, for functioning of both individumateri-al organizations and the whole supply chain their power and effects. Network relations shaped by individual links of the supply chain are one of strategies listed in literature of improving the resistance (Kramarz & Kramarz, 2012)
Supply chains must be immune to events being able to provoke disruptions in material flows. Organizations forming the supply chain should so effectively adapt themselves to changeable environmental conditions. In their paper Dat-ta P. et al. (2007) broaden the definition of the resisDat-tance of a supply chain, Dat-taking into account both the ability to maintain inspection during the variability (devia-tions) arising as a result of appearing disruptions and having the property of being adaptive and capable of responding to sudden and significant changes in the envi-ronment, appearing as a result of uncertain demands from customers. In the paper the resistance is referred to the structure of the entire network supply chain, yet the adaptivity is referred to preservation of individual nodes forming this structure.
Christopher M. (2004) observes that one of the essential ways of achieving re-sistance is creating networks which are capable of responding more quickly to varia-ble conditions. Other authors investigating the ways in which enterprises can res-pond to different types of disruptions and concentrate on strengthening the resis-tance of a supply chain, indicated (Sheffi & Rice, 2005), (Tang, 2006): strategic adaptivity obtained thanks to reduction of the probability of disruptions via monitor-ing and early warnmonitor-ing systems, the structure of a supply chain allowmonitor-ing quick reac-tion to the customer's needs (Lenort & Wicher 2012), the structure of s supply chain with a large-scale network collaboration (Christopher & Peck, 2004), (Mason-Jones, Naylor & Towilld 2000), operating flexibility through standardization of parts which facilitate replaceability (Handfield & McCormack 2008), a strategy of postponed production (for multi-variant products with a difficult-to-forecast demand for indi-vidual variants) or a strategy of mass indiindi-vidualisation (for multi-variant products with predictable demand for individual variants) (Kramarz & Kramarz 2012), man-aging relations with customers and suppliers (Kramarz, 2012). Formation of network relations comprising competitive enterprises on a given level of a supply chain (the network structure of a supply chain) can consequently, according to researchers into this issue, increase its immunity to disruptions.
In network supply chains one can distinguish kinds of disruptions (on account of the organization responsible for their formation) which can cause undesirable delays in delivering goods to their destinations: disruptions independent from any of the participants of a network supply chain, disruptions resulting from the recipi-ent's fault (the customer's fault), disruptions resulting from the carrier's fault, dis-ruptions resulting from the supplier's/the subcontractor's fault.
Disturbances independent from any of the participants of a network supply chain are all accidents causing delays in deliveries which are not influenced in any way by any of the parties. Such situations are, for instance, natural disasters such
as earthquakes, floods, hurricanes, etc. and also bad weather conditions, for example, strong snowfall, the rain, the hail, etc. which make it impossible to deliver goods in time. This group also includes different kinds of strikes which cause disturbances of suppliers' work or stoppages the traffic through roadblocks by protesters. As a result of protests there are often traffic jams, which considerably extend the time of delivery of goods.
3. IDENTYFIKATION OF DISRUPTIONS IN MATERIAL FLOW
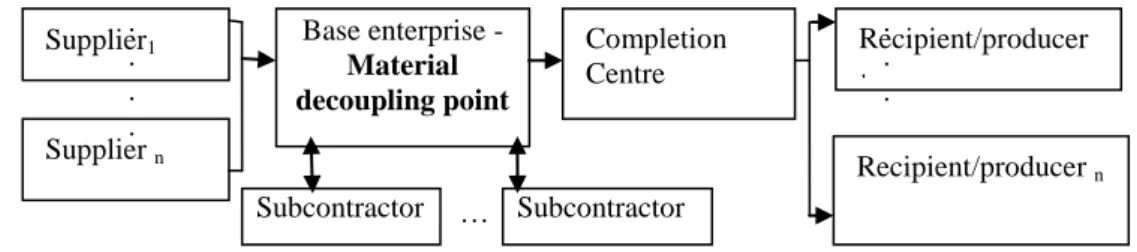
The research took into account material flows within the supply chain of the automotive industry (Fig. 1). The main tasks of the link in which the measurement of disruptions was performed are consolidation and shipment of parts within the supply chain of the General Motors factory. In the investigated supply chain, this link is an intermediary element between the material decoupling point and recipients/producers. The material decoupling point is understood as a point in the supply chain which links the part of the supply chain (recipients/producers) con-trolled by demand with the part of the chain concon-trolled by supply (suppliers).From the perspective of the material decoupling point, which is responsible for the role of controlling the flows in a supply chain, the analysis of disruptions in the subse-quent link (the completion centre) provides essential information on the quality of the realized logistic processes and those parameters which require improvement.
Fig. 1 The structure of a supply chain, Source: authors' study
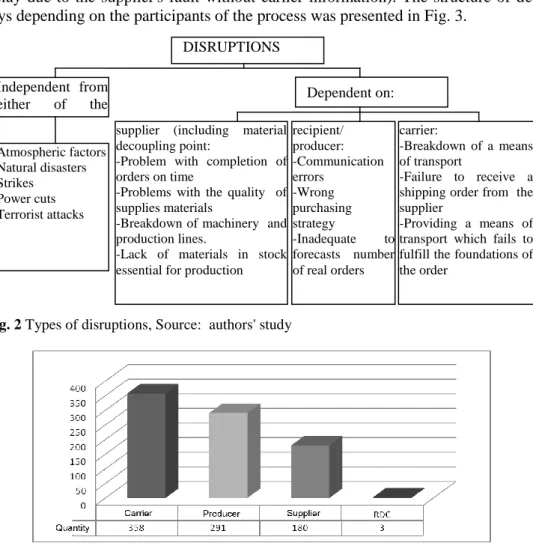
In compliance with the mentioned sources of disruptions formation were classi-fied as: sources independent from any of the parties, sources resulting from the fault of the base enterprise, sources resulting from the carrier's fault, sources resulting from the supplier's / the subcontractor's fault, sources resulting from the recipient's fault. The classified types of disruptions were presented in Fig. 2.
In the analysis the authors' used the source data of an enterprise, recorder by the specially appointed unit responsible for monitoring the punctuality of mate-rials supplies. Delays were recorded in the system by the worker as soon as a giv-en shipmgiv-ent does not appear at the appointed time.
Every delay is associated with a special code which is its mark (D04 - delay due
Supplier1 Supplier n Base enterprise - Material decoupling point Completion Centre Recipient/producer 1 . . . Recipient/producer n . . . . Subcontractor 1 Subcontractor n …
to the carrier's fault with earlier information, D05 - delay due to the carrier's fault without earlier information, T04 - delay due to the end carrier's fault with earlier information, T05 - delay due to the end carrier's fault without earlier information, T40 - too quick arrival of shipment, P99 - change of unloading through the factory (the producer), R04 - delay due to the fault of the consolidation centre with earlier information, V04 - delay due to the supplier's fault with earlier information, V05 - delay due to the supplier's fault without earlier information). The structure of de-lays depending on the participants of the process was presented in Fig. 3.
Fig. 2 Types of disruptions, Source: authors' study
Fig. 3 The number of delays with reference to the participants of the process, Source: study based on the internal data of the enterprise
Delays due to the carriers' fault, namely: D04, D05, T04, T05 in reality concern the same subject. Codes D04 and D05 are delay marks which are associated with the carrier operating on routes from the material decoupling point to the investigat-ed enterprise. However, codes T04 and T05 are grantinvestigat-ed to those carriers who take
DISRUPTIONS Independent from either of the parties Dependent on: Atmospheric factors Natural disasters Strikes Power cuts Terrorist attacks
supplier (including material decoupling point:
-Problem with completion of orders on time
-Problems with the quality of supplies materials
-Breakdown of machinery and production lines.
-Lack of materials in stock essential for production
recipient/ producer: -Communication errors -Wrong purchasing strategy -Inadequate to forecasts number of real orders carrier: -Breakdown of a means of transport -Failure to receive a shipping order from the supplier
-Providing a means of transport which fails to fulfill the foundations of the order
material from the so-called "collective routes” which are consolidated by the con-solidation centres using regional carriers in the first instance. In the second stage of this process, after completing the whole supplied batch, it is taken by other car-rier and delivered to the investigated enterprise.
In the analysed year altogether 832 delays were recorded. The most frequent code is the code P99. This code is issued when a change regarding a given delivery is sent by the manufacturer (the recipient). However, this does not mean that in each case of such an event the recipient is to blame. In many situations the recipient changes also the delivery time, which was determined earlier, on the supplier's request. How-ever, changes are introduced to the system as changes of the recipient' requirements. Most delays are attributed to carriers. Delays caused by carriers are the sum of codes D04, D05, T04, T05, T40, which is 348 delays in total. The least frequent code is R04, that is a delay due to the fault of the consolidation centre. This is an unusually rare situation, these delays are issued most often in the event of disappearance of material in the centre. However, if a given consolidation centre does not receive a supply from a regional carrier, the delay is issued to the responsibility of the carrier or the supplier depending on the indicated and confirmed reason of the delay.
Another stage of research was an analysis of delays over the entire year in the quantitative form monthly. The comparison of the obtained results with se-lected factors characterizing the amplification of disruptions in supply chains, al-lowed analysing the reasons of such a state of affairs. Also, there was an attempt to analyse the influence of the type of the participant of the process responsible for the resultant disturbance on the structure of disruptions within the investigated year monthly. The month in which least delays appeared is January, however, most dis-ruptions can be observed in October. In the first quarter of the year delays remain on a level which is relatively similar to one another. An exception from this rule is February, in which their increase can be observed. In the second quarter the number of delays begins to grow slowly and its greatest number can be observed in August. This delivery can last even up to three weeks. That is why reserves must be properly bigger. In the third quarter of the year a significant increase in delays can be observed. This situation can be influenced by the approaching end of the year. Therefore, the identified key source of interference are production times.
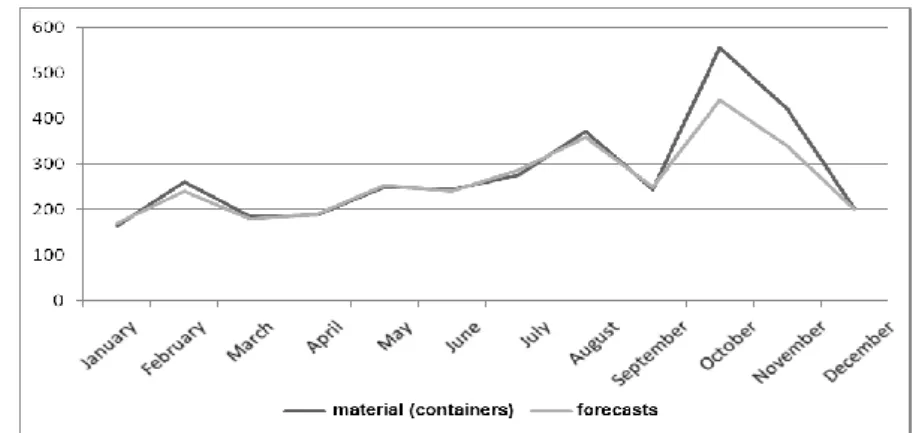
Fig. 4 A comparison of the number of delays with the received material, Source: study on the basis of the internal data of the enterprise
At the beginning of the year the completion centre and the material decoupling point receive a production forecast from the producer for the whole current year. The long-term forecast is created based on estimated data concerning the primary demand. Hence, data are updated systematically and can undergo changes in indi-vidual months. A comparison of forecast orders with their real state was presented in Fig. 4. The dark line symbolizes the real number of the received material, how-ever, the bright line indicates the producer's forecast. In October and November deviations of forecasts, compared with the real quantity of material, are considera-ble. One of reasons of such a state of affairs in this period was the producer's mate-rials system orders which generated a certain part of orders from the following month (November) in advance. It cannot be excluded that a human error might occur in this situation.
The mentioned factors influenced also the number of disruptions at that time. The growth of disruptions due to the producer's and the suppliers' fault (the materi-al decoupling point) in August and December is caused by changes which are con-nected with the periods of "shutdown”, holidays and the New Year in which deliver-ies are blocked and postponed to other dates. However, in October the number of disruptions arising due to the producer's fault is justified with the situation de-scribed earlier, connected with the surplus of the ordered material, significantly dif-ferent from the forecast sizes resulting from production budgets. It required chan-ging the dates of deliveries which could not be realized by the material decoupling point. In that month one can observe also a growth of disruptions in both the suppli-ers and the carrisuppli-ers. This is also a result of increased demand. Particularly, the mate-rial decoupling point was not prepared well enough for such fluctuations of demand. The increase in orders was accompanied with a growth of the amount of work con-nected not only with production of details, but also with loading given batches of deliveries onto the carriers' cars. As a consequence, this disturbance caused lacks of prepared completely deliveries, and what is more, delays connected with
expecta-tion for them to be supplemented with missing parts. Consequently, in the further analysis it became one of the factors considered in the adaptive strategy of the mate-rials decoupling point. Such delays generate a number of other inconveniences con-nected e.g. with stoppages on the loading docks of the semitrailers waiting for the remaining material, which contributes to blocking of shipments. Analogically, such a situation became a problem for those carriers whose cars were blocked at the supplier's, waiting for loading or unloading of material even for 36 hours.
4. MODELLING OF STRATEGY OF IMPROVING RESISTANCE
Modeling of strategy of improving the resistance of supply chain requires de-fining of the central link of the supply chain, that is the crucial enterprise which is decisive in maintaining continuity logistic and production processes in the sup-ply chain. Strategy of this enterprise must be so designed as not to amplify disrup-tions and enable this link to adapt itself to the resultant condidisrup-tions and consequent-ly limit negative results of the resultant disruptions in other chain links of a suppconsequent-ly chain. A major factor amplifying the disturbance in the investigated supply chain are production times both at the recipient's as and in the material decoupling point. These periods are an element of the productivity management in these organiza-tions and are essential.
Therefore, the strategy (strategy of improving resistance of supply chain) of the base enterprise requires regarding the schedules pauses in the manufactur-ing process. The previous strategy took into account one pause lastmanufactur-ing 4 weeks. In connection with the accumulation of disruptions within a non-production peri-od, which was difficult to eliminate by means of suitable stock levels, especially when unplanned events took place (such as, for example, incorrectly estimated demand) two variants of pauses were considered: the first variant according with the previous strategy of the material decoupling point, and the second variant in which two 2-week pauses were scheduled, between which 6-, 4- or 2-week production time were analysed.
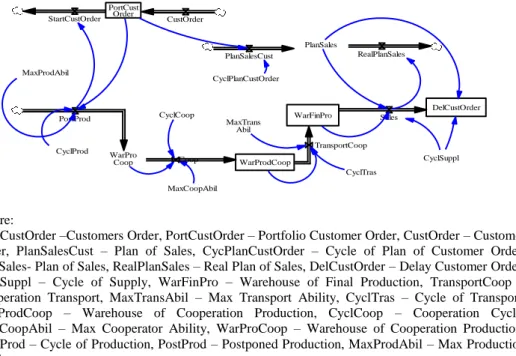
The simulation model was developed in the VENSIM tool in the systems dy-namics technology (Fig. 5).
WarFinPro PostProd Sales CyclProd DelCustOrder CyclSuppl MaxProdAbil Coop CyclCoop MaxCoopAbil WarProdCoop TransportCoop CyclTras WarPro Coop PlanSales PortCust Order CustOrder StartCustOrder RealPlanSales CyclPlanCustOrder PlanSalesCust MaxTrans Abil Where:
StartCustOrder –Customers Order, PortCustOrder – Portfolio Customer Order, CustOrder – Customer Order, PlanSalesCust – Plan of Sales, CycPlanCustOrder – Cycle of Plan of Customer Order, PlanSales- Plan of Sales, RealPlanSales – Real Plan of Sales, DelCustOrder – Delay Customer Order, CyclSuppl – Cycle of Supply, WarFinPro – Warehouse of Final Production, TransportCoop – Cooperation Transport, MaxTransAbil – Max Transport Ability, CyclTras – Cycle of Transport, WarProdCoop – Warehouse of Cooperation Production, CyclCoop – Cooperation Cycle, MaxCoopAbil – Max Cooperator Ability, WarProCoop – Warehouse of Cooperation Production, CyclProd – Cycle of Production, PostProd – Postponed Production, MaxProdAbil – Max Production Ability
Fig. 5 The simulation model taking into account productivity management, Source: authors' study
The model took into account cooperation as regards subcontracting of produc-tion targets. The cooperaproduc-tion contract between the material decoupling point and the subcontractor defines the level of production capacities used for realization of tasks commissioned as subcontracting. The shipping enterprise completes orders and realizes the delivery after completing the orders. The model took into account production reserves, reserves for cooperation and reserves of final goods (details sent to the completion centre). The production is realized to order.
The simulation was carried out for 50 weeks. The simulation algorithm took into account the results of the identification of disruptions. The results of the experi-ments indicate explicitly that the biggest level of disruptions (measured with deliver-ies uncompleted on time) is generated with the strategy with one 4-week period of production shutdown. Analysing the results of the variants of separating the period of production shutdown 2 times 2 weeks it can be concluded that the period after which the system returns to the state of equilibrium after 2-week shutdown of the production process is the period of 4 weeks. Consequently, assuming that the enterprise performing the role of the material decoupling point should aim at working out such a strategy that will assure a continuous material flow and will increase the resistance of the entire supply chain to disruptions, this strategy should
take into account the production capacities management (workforce or productivity) through shutdown them periodically and adapting to the volume of demand, for two 2-week non-productive periods between which there is a 4-week productive period. Such a solution is essential if one considers the isolated problem of disruptions, in practice additional factors should be taken into account, such as the costs of supply stoppages (non-utilization of production capacities), periods of time essential for repairs which should tie in with non-productive periods of time.
5. CONCLUSIONS
The stormy environment and large fluctuations of demand induce many enter-prises to cooperate with other organizations in supply networks. Enterenter-prises try to cooperate in different configurations allowing an increase in added value. Since the basic processes forming the utility of the form, the place and the time are pro-ductive operations and logistic processes, hence cooperation in these two task areas is more and more essential. Enterprises should collaborate with one another so as to build the resistance of the entire supply chain to disruptions. Experience sharing, good communication and a common approach to the issue of disruptions will allow reaching measurably better effects than in the case of an individual approach.
As indicated by the analysis of delays, presented in the paper based on the re-search carried out in a selected chain link of a supply chain of the automotive in-dustry, the accumulation of problems in one of enterprises generates problems in another one. It also results in extending the time essential to remove and restore the stability in the entire production and logistic system. The most essential identi-fied disturbance intensifier is the periodic disconnection of the production capacity in certain network nodes. That is why this factor was taken into account in the adaptive strategy of the material decoupling point. At this stage of the re-search, due to the number of measurements limited to the period of one year, the authors did not take into account all the factors mentioned in the literature. Howev-er, the investigations undertaken in this range will be continued within the frame-work of the research project “The computer system to aid flow management in a network of enterprises as exemplified by metallurgic products”.
REFERENCES
Christopher M. & Peck H. (2004), The five principles of supply chain resilience, Logistics Europe vol 12(1), pp. 16-21.
Christopher M. (2004), Creating resilient supply chains, Logistics Europe, pp. 14-22. Datta P., Christopher M. & Allen P. (2007), Agent-based modeling of complex
produc-tion/distribution systems to improve resilience, International Journal of Logistic: Research and Applications, Vol. 10, No. 3, pp. 187-203.
Handfield R. & McCormack K. (2008) Supply chain risk management. Minimizing disrup-tions in global sourcing, Auerbach Publicadisrup-tions Taylor &Francis Group, New York, pp. 56-82.
Janssen M. & Feenstra R. (2010), Service portfolios for supply chain composition: Creating business network interoperability and agility, International Journal of Computer Integrated Manufacturing, Vol. 23 No. 8-9, pp. 747-757.
Kramarz M. & Kramarz W., (2012) The adaptive strategy in production capacities in a supply chain in the conditions of variable demand, Conference proceedings, Carpathian Lo-gistics Congress 2012.
Kramarz M. & Kramarz W. (2012), „Analiza zakłóceń w wybranym ogniwie łańcucha do-staw branży motoryzacyjnej, Logistyka Vol 4 (CD).
Kramarz M. (2012), Strategie adaptacyjne przedsiębiorstw flagowych sieci dystrybucji z o-droczoną produkcją. Dystrybucja wyrobów hutniczych, Wydawnictwo Politechniki Śląskiej, Gliwice.
Lenort R. & Wicher P., (2012), Nowe trendy w zarządzaniu łańcuchem dostaw oraz ich porównanie i integracja, Logistyka Vol 2, pp. 851-852.
Mason – Jones R., Naylor B. & Towilld. (2000), Lean, agile or leagile? Matchnig your Supply Chain to the marketplace, International Journal of Production Research, vol. 30(17), pp. 4061-4070.
Sheffi Y. & Rice J. (2005), A supply chain view of the resilient enterprise, MIT Sloan Management Review, No. 47(1) pp. 41-48.
Tang C., (2006), Perspectives in Supply Chain Risk Management, International Journal of Production Economics, vol. 103, pp. 451-488.
BIOGRAPHICAL NOTES
Marzena Kramarz, the professor of Silesian University of Technology in the
Management and Administration Institute at the Department Organization and Management. The author of the monograph "Adaptive strategies of flagship enterprises of a distribution network with postponed production. Distribution of metallurgic products", Gliwice 2012, and also numerous articles from the field of logistics including especially the management of a supply chain and a supply network. The co-author of academical manuals. Her scientific interests include: designing networks and supply chains, logistic customer service, the efficiency of organizations cooperating in networks.
Włodzimierz Kramarz, the assistant professor in the Management and
Administration Institute at the Department Organization and Management of the Silesian University of Technology. He is the author of publications from the field of supply chain, IT systems supporting logistic management, simulation modelling. He has practical experience in the management and realization of information technology projects. The realized projects in the industry refer to technical
preparation of production and logistics. In the methodological aspect the author's main interest is simulation modelling and its utilization to decision support.