University of Bialystok
Faculty of Biology and Chemistry
Magdalena Fiłoc
Postglacial vegetation changes of the Wigry National Park
on the background of cold climatic oscillations
PhD dissertation
Supervisor: dr hab. Mirosława Kupryjanowicz, prof. UwB
Auxiliary supervisor: dr hab. Danuta Drzymulska
I would like to thank my supervisor, dr hab. Mirosława Kupryjanowicz prof. UwB,
whose help and support was a key element in my PhD dissertation.
3
Table of contents
I. Summary……….……….………..………..
5
II. Streszczenie.……….………...…………..………... 11
III. Articles included in the PhD dissertation ……….…………... 17
1.
Late Glacial and Holocene vegetation changes in the Wigry National
Park, NE Poland – new pollen data from three small dystrophic lakes.
Fiłoc M., Kupryjanowicz M., Drzymulska D.……….
19
2. Response of terrestrial and lake environments in NE Poland to Preboreal
cold oscillations (PBO). Fiłoc M., Kupryjanowicz M., Rzodkiewicz M.,
Suchora M.………
33
3. Environmental changes related to the 8.2 ka event and other climate
fluctuations during the Middle Holocene – evidence from two dystrophic
lakes in NE Poland. Fiłoc M., Kupryjanowicz M., Seroczyńska K.,
Suchora M., Rzodkiewicz M....………
53
5
I. SUMMARY
Postglacial vegetation changes of the Wigry National Park
on the background of cold climatic oscillations
Magdalena Fiłoc
Intermittent cold glacials and warm interglacials occurred regularly during the
Quaternary period. Each glacial-interglacial cycle was characterised by changes of climate
and vegetation (Iversen, 1958). In general, the pattern of environmental changes during each
cycle was very similar. Glaciation (the cryocratic stage of the cycle with the lowest
temperatures) was followed by the oldest part of the interglacial, when temperatures gradually
increased and subsequently soils and pioneering birch and pine forests were formed (the
protocratic stage). The middle part of the cycle was the warmest climatic optimum of the
cycle (the mezocratic stage). The sequence of occurrence of dominant thermophilic trees
during the climatic optimum was characteristic of each cycle. Further, gradual climate cooling
took place, accompanied by decreasing soil fertility and impoverishment of vegetation
(telocratic stage), progressing until the beginning of the next glacial (cryocratic stage of the
next glacial-interglacial cycle).
During the Holocene, which lasted ca. 11550 years, as in all previous interglacials, the
pattern of environmental changes was consistent with the above-described one. However, the
palaeoecological reconstructions employing increasingly higher-resolution chronostratigraphy
carried out in recent decades revealed that the typical interglacial climate changes during the
Holocene coincided with quite regular sudden and short (ca. 150-50 years) cooling periods.
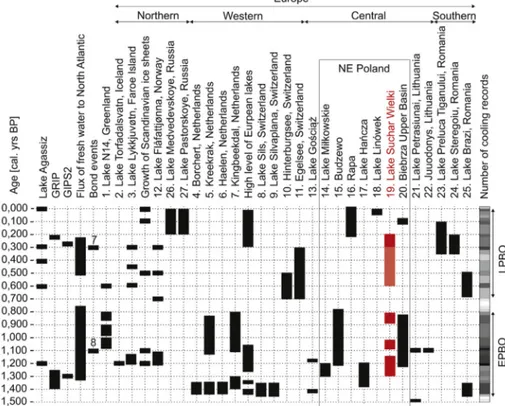
They form a series of climatic events repeated at every ca. 1470±500 years. These events
(Bond cycles) have been investigated in detail in ice cores from Greenland and marine
sediments from the North Atlantic. They also affected other parts of the world, which is
reflected in the record of vegetational changes in some parts of Europe and fluctuations in
water levels in the Central European lakes - a detailed literature review on this issue is
provided in articles 2 and 3. These records show that palaeoecologists have still not reached a
consensus on the global nature of cold mid-Holocene climatic events and the intensity of their
effect on the environment in different regions of the world. Therefore, further
palaeoecological studies aimed at clarifying these phenomena are necessary.
Particularly valuable information regarding the impact of sudden climatic events on
vegetation are obtained from studies in regions where plants are most sensitive to all
transition zone between oceanic and continental climates. Many plant species have their limit
of distribution here, which also means the limit of their ecological tolerance. Considering this
fact, even minor and short-term climate changes may improve or deteriorate the condition of
specimens representing these species and change pollen production, while prolonged cold
periods may lead to significant changes in the composition of vegetation due to changes in the
size of populations of some species, and may even shift the limits of their distribution range.
The main objective of the palaeoecological research carried out in Wigry National Park,
located in north-eastern Poland, was to determine potential records of short mid-Holocene
climate oscillations in this region and the impact of these oscillations on the postglacial
development of vegetation. Three detailed aims of the study were formulated under the
primary aim, and they also corresponded with stages of research: (1) to reconstruct the main
stages of vegetational changes in the analysed region; (2) to identify possible disturbances in
the interglacial vegetational succession and their climatic reasons through their
chronostratigraphic correlation with short-term climate oscillations; (3) to explain whether
changes were transient and had no significant impact on the vegetational succession during
Holocene, which primarily depended on the main trend in the interglacial climatic pattern, or
whether these changes had a significant impact on the succession pattern of Holocene
vegetation, initiating or modifying its subsequent stages.
Deposits from three lakes were analysed: Suchar Wielki, Suchar II and Ślepe. The
research mainly relied on pollen analysis, which allowed for the reconstruction of changes in
terrestrial vegetation around the investigated lakes and in the them. The age of the analysed
deposits was determined using radiocarbon dating and palynostratigraphic correlation of
obtained pollen profiles with well-dated profiles from Wigry and Szurpiły lakes. Findings
from additional palaeoecological analyses, such as cladoceran and diatom analysis conducted
by specialists in this discipline, were also used for the interpretation of the obtained pollen
data.
Data from the preliminary pollen analysis of sediments from all the investigated lakes
are presented in article no. 1. They were used for the reconstruction of major stages of
vegetational succession in the region of Wigry National Park in the late glacial of the last
glaciation (Suchar Wielki) and during the Holocene (all the investigated lakes). The obtained
pollen record was used to identify 10 regional pollen zones (R PAZ) characterising these
stages. The study revealed that vegetational succession at that time was strongly shaped by the
trend in glacial and interglacial climate changes, but some short-term changes in vegetation,
7
potentially caused by cold climate oscillations, were also documented. One of such changes
was a sudden short-term expansion of birch in the younger part of the Preboreal period,
possibly in response to climate cooling called Preboreal oscillation (PBO; 8
thBond event).
The second was a temporary spread of spruce which was marked in the Subboreal period and
could be associated with one of the cold climate oscillations of that period.
The reconstruction of the main stages of Holocene vegetational succession in the
vicinity of the investigated lakes and identification of Holocene phases characterised by the
probable effects of sudden climate cooling on the vegetation of Wigry National Park was
followed by a more detailed investigation of changes in vegetation in two of these periods.
Article no. 2 presents a detailed reconstruction of changes in vegetation around and in
Suchar Wielki lake during the Preboreal period (ca. 1160-9800 cal. years BP). Pollen analysis
for that time documented as many as four short-term (ca. 50-150 years) cold climatic events.
The first three were dated at ca. 11300-11150, 11100-11000 and 10900-10850 cal. years BP,
and were separated by relatively short (ca. 50-100 years) warmer periods, which documents
the significant climate instability of the older part of the Preboreal period. The last registered
cooling took place in the younger part of the Preboreal period ca. 10300-10200 cal. years BP,
and was preceded by a ca. 300-year-long gradual climate cooling. A series of three cold
events recorded in the older part of the Preboreal was correlated with a Bond cycle, when the
lowest temperature was dated at 11100 cal. years BP, and cooling registered in the younger
part of this period with the Bond cycle was dated at 10300 cal. years BP.
The three early-Preboreal cold events corresponding with event 11.1 ka were reflected
in the pollen record as lower pollen concentrations for both three species forming forests at
that time, pine and birch, indicating a significantly limited florescence, and pollen production
by these trees. During the oldest of these cold events the response of birch to cooling was less
pronounced that of pine, which, in diagrams with pollen percentage, was manifested by the
decreased share of Pinus pollen and peak value for Betula pollen. On the other hand, during
both younger cold events, the response of pine and birch, reflected in limited pollen
production due to climate deterioration, was very similar, which may suggest that the
temperature drop was less marked at that time than during the oldest cooling. The
composition of birch and pine forests probably did not change in any of the early-Preboreal
cold events, which only caused changes in the intensity of pollen production by trees forming
forests.
Late-Preboreal cooling correlated with event 10.3 ka in the area of Wigry National Park
was associated with reduced climate humidity. During this cold event a short-term spread of
concentration for this taxon increased, as well as its percentage share.
The comparison of obtained palynological and palaeoecological records for different
parts of Europe has led to the conclusion that changes in flora and fauna described for the
Preboreal periods probably occurred in response to a sequence of cold events that had
different effects on the natural environment, and thus the response was different across the
European continent.
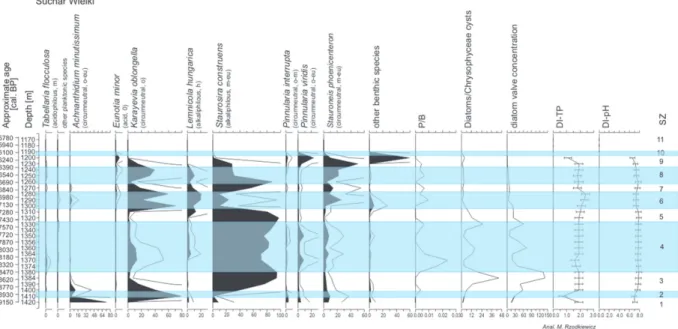
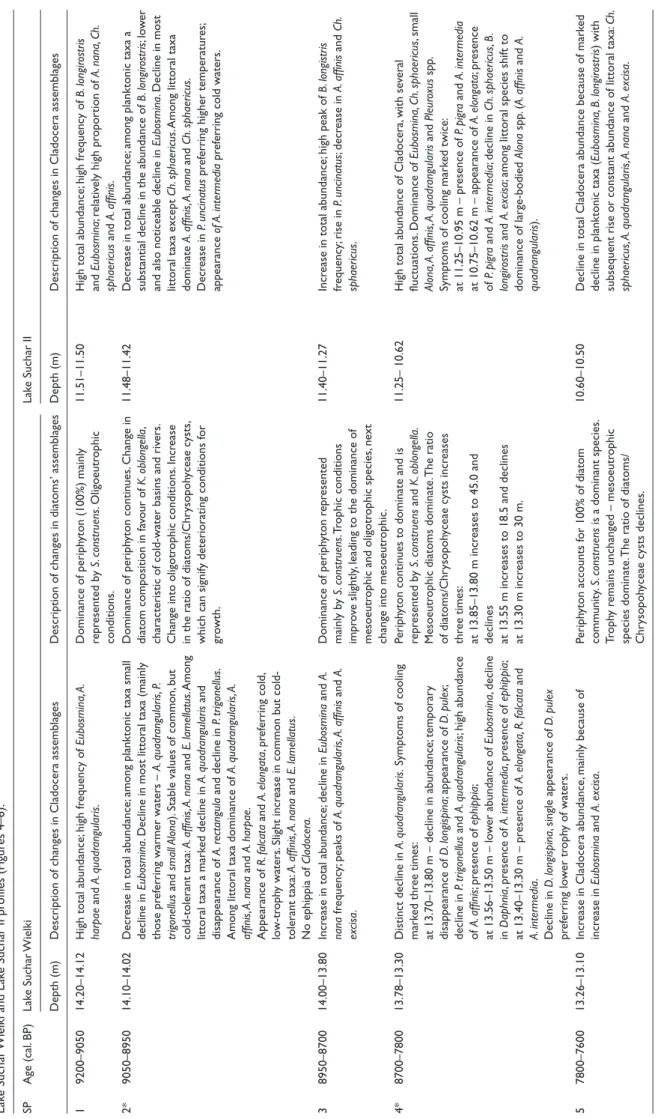
Article no. 3 presents a detailed reconstruction of changes in vegetation cover around
and in Suchar Wielki and Suchar II lakes during the Atlantic period (ca. 9200-5750 cal. years
BP). The reconstructed changes in vegetation pointed to five cold events during that time,
dated at ca. 9050-8950, 8700-7800, 7600-7250, 7100-6600 and 6050-5900 cal. years BP. The
most important was the second cold event, chronostratigraphically corresponding with
oscillation 8.2 ka (5
thBond cycle).
It was demonstrated in this paper that cooling correlated with event 8.2 ka, and in the
investigated area it could have lasted even ca. 900 years. During that period a temporary
remodelling of forests probably took place, associated with changes in the share of individual
forest-forming tree species. It was documented that hazel was the most sensitive to climatic
oscillations considering all trees and shrubs forming forest community in the investigated
area. In the pollen record this was reflected in a significant drop in hazel pollen
concentrations, which, among other things, corresponded with a reduced percentage share of
hazel, and could also result from the limited area of hazel during cold event 8.2 ka.
Other Atlantic coolings probably lasted for only several to several dozen seasons, with
longer and colder winters, and affected only the intensity of pollen production by plants,
particularly thermophilic ones. This suggests that all these climate changes had a much
weaker effect on the local environment than the cooling at 8.2 ka. Nevertheless, the results of
palynological studies confirmed the occurrence of a series of cold events that were also
reported for other regions of Europe.
In conclusion, the high-resolution reconstruction of the postglacial vegetation
development in the Wigry National Park area and the parallel changes in the aquatic
environment of the studied lakes have provided new and important information on the effects
of short-term, cold, mid-Holocene climate oscillations on the pattern of vegetational
succession during the Holocene. The response of vegetation in Wigry National Park to
climate cooling, i.e. Bond cycles, was documented. Thus, new data on the global nature of
these climate oscillations has been provided. It has been shown that only coolings dated at ca.
9
10.3 ka and 8.2 ka could have caused a temporary remodelling of vegetation in the
investigated area, while other cold events caused only periodic reduction in pollen production
by trees and shrubs. This clearly shows that the cold events had no significant effect on the
pattern of vegetational succession. Nevertheless, the reported cold events are important for the
chronostratigraphic correlation of various records of environmental changes that took place in
Europe. In addition, the obtained results helped identify climate changes of variable impact on
the natural environment, indicating the complexity of correlations between climate and
vegetation, and emphasizing the role of differences in the response of individual tree species,
e.g. birch and hazel, during particular stages of the Holocene.
11
II. STRESZCZENIE
Postglacjalne zmiany roślinności Wigierskiego Parku Narodowego
na tle chłodnych oscylacji klimatycznych
Magdalena Fiłoc
W czwartorzędzie regularnie przeplatały się z sobą okresy zimne zwane glacjałami i
okresy ciepłe zwane interglacjałami. Każda jednostka złożona z glacjału i następującego po
nim interglacjału określana jest jako cykl klimatyczno-roślinny (Iversen, 1958). Przebieg
zmian środowiska zachodzących w czasie każdego takiego cyklu był generalnie bardzo
podobny. Po zlodowaceniu (stadium kriokratyczne cyklu z przypadającą tu kulminacją
zimna), w najstarszej części interglacjału następowała stopniowa poprawa warunków
termicznych, pociągająca za sobą rozwój gleb i pionierskich lasów brzozowo-sosnowych
(stadium protokratyczne). W środkowej części cyklu dochodziło do kulminacji ocieplenia,
czyli optimum klimatycznego cyklu (stadium mezokratyczne). Kolejność pojawiania się
drzew termofilnych dominujących podczas optimum klimatycznego była cechą
charakterystyczną każdego cyklu. Potem następowało stopniowe ochładzanie się klimatu,
któremu towarzyszyło ubożenie gleb i roślinności (stadium telokratyczne), postępujące aż do
początku kolejnego glacjału (stadium kriokratyczne następnego cyklu
klimatyczno-roślinnego).
W trwającym od ok. 11550 lat holocenie, tak jak we wszystkich wcześniejszych
interglacjałach, zmiany środowiska przebiegały według opisanego powyżej schematu. Jednak
w ostatnich dekadach, dzięki rekonstrukcjom paleoekologicznym o coraz wyższej
rozdzielczości chronostratygraficznej, okazało się, że na typowy dla interglacjału trend zmian
klimatu holocenu nałożyły się pojawiające się dość regularnie nagłe, krótkotrwałe (ok. 150-50
lat) ochłodzenia. Tworzą one serię epizodów klimatycznych powtarzających się z
cyklicznością co ok. 1470±500 lat. Epizody te (tzw. cykle Bonda) zostały szczegółowo
rozpoznane w rdzeniach lodowych z Grenlandii i w osadach morskich z północnego
Atlantyku. Objęły także inne rejony świata, co zarejestrowano między innymi w zapisie
zmian roślinności niektórych częściach Europy i wahań poziomu wód w
środkowoeuropejskich jeziorach – szczegółowy przegląd literatury odnoszącej się do tej
problematyki przedstawiono w artykułach nr 2 i 3. Wynika z niego, że ciągle jeszcze nie ma
wśród paleoekologów zgodności co do globalnego charakteru chłodnych śródholoceńskich
rejonach świata. Dlatego kolejne badania paleoekologiczne nastawione na wyjaśnienie tych
zjawisk są niezbędne.
Do badań nad wpływem nagłych zdarzeń klimatycznych na roślinność szczególnie
cenne są rejony, na których rośliny są najbardziej wrażliwe na wszelkie zmiany środowiska,
w tym klimatu. Takim rejonem jest m.in. północno-wschodnia Polska położona w strefie
przejściowej pomiędzy klimatem oceanicznym i kontynentalnym. Wiele gatunków roślin ma
tutaj granice swojego zasięgu, co oznacza, że występują one na progu swojej tolerancji
ekologicznej. W tej sytuacji nawet niewielkie i krótkotrwałe zmiany klimatu mogą skutkować
poprawą lub pogorszeniem kondycji przedstawicieli tych gatunków i zmianami w
intensywności ich pylenia, a dłużej trwające okresy chłodu mogą prowadzić do istotnych
zmian w składzie roślinności, wynikających ze zmian liczebności populacji niektórych
gatunków, a nawet z przesuwania się granic ich zasięgu.
Głównym celem badań paleoekologicznych podjętych na terenie położonego w
północno-wschodniej Polsce Wigierskiego Parku Narodowego było ustalenie, czy
uwidoczniły się w tym rejonie krótkotrwałe, śródholoceńskie oscylacje klimatu i czy miały
one wpływ na postglacjalny rozwój roślinności. W ramach tak ujętego celu głównego
sformułowano kilka celów szczegółowych, które wyznaczały jednocześnie kolejne etapy
prowadzonych badań: (1) rekonstrukcja głównych etapów przemian szaty roślinnej badanego
regionu; (2) wskazanie ewentualnych zaburzeń w interglacjalnej sukcesji roślinności i
rozpoznanie ich klimatycznych przyczyn poprzez chronostratygraficzne skorelowanie tych
zmian z krótkotrwałymi wahnieniami klimatu; (3) ustalenie czy były to zmiany przejściowe,
nie wpływające w istotniejszy sposób na przebieg holoceńskiej sukcesji roślinności, która
zależała przede wszystkim od głównego trendu w interglacjalnym rozwoju klimatu, czy też
zmiany te wywarły znaczący wpływ na przebieg holoceńskiej sukcesji roślinności, inicjując
lub modyfikując jej kolejne etapy.
Badaniom poddano osady trzech jezior: Suchar Wielki, Suchar II i Ślepe. Główną
metodą badawczą była analiza pyłkowa, która umożliwiła odtworzenie zmian roślinności
zarówno w otoczeniu badanych jezior jak i w nich samych. Wiek badanych osadów określono
metodą radiowęglową oraz poprzez korelację palinostratygraficzną uzyskanych profili
pyłkowych z dobrze datowanymi tą metodą profilami z jezior Wigry i Szurpiły. Przy
interpretacji uzyskanych danych pyłkowych wykorzystano także rezultaty dodatkowych
analiz paleoekologicznych, takich jak analiza wioślarkowa i okrzemkowa, które zostały
wykonane przez specjalistów w danej dziedzinie.
13
Dane uzyskane w wyniku wstępnej analizy pyłkowej osadów wszystkich badanych
jezior przedstawiono w artykule nr 1. Pozwoliły one na odtworzenie głównych etapów
rozwoju roślinności regionu Wigierskiego Parku Narodowego w późnym glacjale ostatniego
zlodowacenia (Suchar Wielki) i w czasie holocenu (wszystkie badane jeziora). Uzyskany
zapis palinologiczny pozwolił na wyróżnienie dziesięciu regionalnych poziomów pyłkowych
(R PAZ) charakteryzujących te etapy. Udowodniono, że sukcesja roślinności w tym czasie
zależała przede wszystkim od głównego trendu w glacjalnym i interglacjalnym rozwoju
klimatu, ale udokumentowano także pewne krótkotrwałe zmiany roślinności, które mogły być
spowodowane przez chłodne oscylacje klimatyczne. Jedną z takich zmian była nagła
krótkotrwała ekspansja brzozy w młodszej części okresu preborealnego, która mogła być
reakcją na ochłodzenie klimatu zwane oscylacją preborealną (PBO; 8 cykl Bonda). Drugą
było przejściowe rozprzestrzenienie się świerka, które zaznaczyło się w okresie suborealnym i
mogło być związane z jedną z zimnych oscylacji klimatycznych tego okresu.
Po odtworzeniu głównych etapów holoceńskiego rozwoju roślinności w sąsiedztwie
badanych zbiorników i wytypowaniu okresów holocenu, w których prawdopodobny był
wpływ nagłych ochłodzeń klimatu na roślinność Wigierskiego Parku Narodowego,
przystąpiono do bardziej dokładnego rozpoznania zmian roślinności w dwóch z tych okresów.
W artykule nr 2 przedstawiono szczegółową rekonstrukcję zmian szaty roślinnej w okolicy
jeziora Suchar Wielki oraz w samym zbiorniku wodnym w okresie preborealnym (ok.
1160-9800 lat kal. BP). Analiza pyłkowa udokumentowała występowanie w tym czasie aż czterech
krótkotrwałych (po ok. 50-150 lat) chłodnych epizodów klimatycznych. Pierwsze trzy z nich
zostały wydatowane na ok. 11300-11150, 11100-11000 i 10900-10850 lat kal. BP i były
oddzielone od siebie stosunkowo krótkimi (po ok. 50-100 lat) okresami charakteryzującymi
się poprawą warunków termicznych, co dokumentuje dużą niestabilność klimatu w starszej
części okresu preborealnego. Ostatnie z zarejestrowanych ochłodzeń miało miejsce w
młodszej połowie okresu preborealnego, ok. 10300-10200 lat kal. BP i było poprzedzone
trwającym przez ok. 300 lat stopniowym ochładzaniem się klimatu. Serię trzech chłodnych
epizodów odnotowanych w starszej części okresu preborealnego skorelowano z cyklem
Bonda, w którym maksimum chłodu datowane jest na 11100 lat kal. BP, a ochłodzenie
zarejestrowane z młodszej części tego okresu z cyklem Bonda datowanym na 10300 lat kal.
BP.
Trzy wczesnopreborealne, chłodne epizody odpowiadające wydarzeniu 11,1 ka
odzwierciedliły się w zapisie pyłkowym poprzez spadki koncentracji pyłku obydwu drzew
budujących ówczesne drzewostany, zarówno sosny jak i brzozy, wskazujące na znaczne
brzozy na spadek temperatury była wyraźnie słabsza niż sosny, co w procentowym zapisie
pyłkowym zamanifestowało się spadkiem udziału pyłku Pinus i kulminacją pyłku Betula.
Natomiast w czasie obydwu młodszych ochłodzeń odpowiedzi sosny i brzozy w postaci
ograniczonego pylenia na pogorszenie się klimatu były bardzo podobne, co może sugerować,
że spadek temperatury był wtedy mniej wyraźny niż podczas najstarszego ochłodzenia. W
żadnym z wczesnopreborealnych ochłodzeń najprawdopodobniej nie doszło do zmiany składu
panujących wtedy lasów brzozowo-sosnowych. Powodowały one jedynie zmiany w
intensywności pylenia budujących je drzew.
Późnopreborealne ochłodzenie korelowane z wydarzeniem 10,3 ka powiązane było na
terenie Wigierskiego Parku Narodowego z obniżeniem wilgotności klimatu. W czasie tego
ochłodzenia mogło dojść do krótkotrwałego rozszerzenia się areału brzozy na badanym
terenie. Świadczy o tym wyraźny wzrost koncentracji pyłku tego taksonu i wynikający z tego
wzrost jego udziału procentowego.
Zestawienie uzyskanych danych palinologicznych z danymi paleoekologicznymi
pochodzącymi z różnych części Europy doprowadziło do wniosku, że zmiany flory i fauny
opisywane w okresie preborealnym w Europie mogły być odpowiedzią na ciąg następujących
po sobie ochłodzeń, z których każde oddziaływało na środowisko przyrodnicze z różną siłą,
przez co odpowiedź na nie była inna w różnych częściach naszego kontynentu.
W artykule nr 3 opracowano rekonstrukcję zmian szaty roślinnej w okolicy jezior
Suchar Wielki i Suchar II oraz w samych zbiornikach wodnych w okresie atlantyckim (ok.
9200-5750 lat kal. BP). Odtworzone zmiany szaty roślinnej wskazały na wystąpienie w tym
czasie pięciu chłodnych epizodów, datowanych na ok. 9050-8950, 8700-7800, 7600-7250,
7100-6600 i 6050-5900 lat kal. BP. Najbardziej znaczące było drugie z tych ochłodzeń,
chrostratygraficznie odpowiadające tzw. oscylacji 8,2 ka (5 cykl Bonda).
W pracy wykazano, że ochłodzenie korelowane z wydarzeniem 8,2 ka, na badanym
terenie mogło trwać nawet ok. 900 lat. W tym okresie mogło dojść do tymczasowej
przebudowy ówcześnie panujących lasów, poprzez zmianę udziału poszczególnych drzew
wchodzących w ich skład. Udokumentowano, że spośród wszystkich drzew i krzewów
tworzących zbiorowiska leśne na badanym terenie, najbardziej wrażliwa na wahania klimatu
była w tym czasie leszczyna. W zapisie pyłkowym, zostało to zarejestrowane jako znaczny
spadek koncentracji jej pyłku, co m.in. przekładało się na spadek udziału procentowego tego
krzewu i mogło być też wynikiem ograniczenia areału leszczyny podczas ochłodzenia 8,2 ka
15
Pozostałe atlantyckie ochłodzenia prawdopodobnie obejmowały tylko po
kilka-kilkadziesiąt sezonów z dłuższymi i chłodniejszymi zimami i wpływały jedynie na
intensywność pylenia roślin, w szczególności termofilnych. Sugeruje to, że wszystkie te
zmiany klimatu miały znacznie mniejszy wpływ na środowisko badanego terenu niż
ochłodzenie 8,2 ka. Nie mniej jednak, wyniki badań palinologicznych, potwierdziły
występowanie serii ochłodzeń, które zostały też zaobserwowane w innych częściach Europy.
Podsumowując, wysokiej rozdzielczości rekonstrukcja postglacjalnego rozwoju
roślinności rejonu Wigierskiego Parku Narodowego oraz przebiegających równolegle z nim
zmian w środowisku wodnym badanych jezior, dostarczyła nowych i ważnych informacji na
temat wpływu krótkotrwałych, chłodnych, śródholoceńskich oscylacji klimatu na przebieg
holoceńskiej sukcesji roślinności. Udokumentowano reakcję roślinności Wigierskiego Parku
Narodowego na ochłodzenia klimatu mi. cykle Bonda. Tym samym dostarczono nowych
danych o globalnym charakterze tych oscylacji klimatycznych. Wykazano, że jedynie
ochłodzenia datowane na ok. 10,3 ka i 8,2 ka mogły spowodować tymczasową przebudowę
szaty roślinnej na badanym terenie. Natomiast, na pozostałe ochłodzenia klimatu drzewa i
krzewy reagowały jedynie okresowym spadkiem intensywności pylenia. Jednoznacznie
pokazuje to, że nie przyczyniły się one w istotny sposób do zmian w przebiegu sukcesji
roślinności. Nie mniej jednak, mają one ważne znaczenie dla korelacji chronostratygraficznej
różnych zapisów zmian środowiska, jakie miały miejsce w Europie. Ponadto, uzyskane
wyniki pozwoliły na wskazanie zmian klimatu o różnej sile oddziaływania na środowisko
przyrodnicze, wykazując złożoność zależności klimat/roślinność oraz podkreślając znaczenie
dynamiki odpowiedzi poszczególnych drzew m.in. brzozy i leszczyny w różnych okresach
holocenu.
17
19
1.
Fiłoc M., Kupryjanowicz M., Drzymulska D. 2014. Late Glacial and Holocene vegetation
changes in the Wigry National Park, NE Poland – new pollen data from three small
dystrophic lakes. Studia Quaternaria 31(1): 5-16, https://doi.org/10.2478/squa-2014-0001.
Studia Quaternaria, vol. 31, no. 1 (2014): 5–16. DOI: 10.2478/squa-2014-0001
LATE GLA CIAL AND HO LO CENE VEG E TA TION CHANGES
IN THE WIGRY NA TIONAL PARK, NE PO LAND – NEW POL LEN
DATA FROM THREE SMALL DYSTROPHIC LAKES
Magdalena Fi³oc, Miros³awa Kupryjanowicz, Danuta Drzymulska
De part ment of Bot any, In sti tute of Bi ol ogy, Uni ver sity of Bia³ystok, Œwierkowa 20b, 15-950 Bia³ystok, Po land;
e-mail: mfiloc@op.pl, m.kupryjanowicz@uwb.edu.pl, drzym@uwb.edu.pl
Ab stract
The main phases of the Late Gla cial and Ho lo cene de vel op ment of veg e ta tion in the Wigry Na tional Park were re con -structed based on the pol len anal y sis of sed i ments from three small dystrophic lakes (Lake Suchar Wielki, Lake Suchar II and Lake Œlepe). At the cur rent stage of re search, the age of the stud ied de pos its was de ter mined by AMS ra -dio car bon dat ing of few sam ples only. This meant that the chro nol ogy of the in ves ti gated pro files had to be es ti mated also in di rectly us ing their palynological cor re la tion with a ra dio met ri cally well-dated pro file from Lake Wigry. The ob tained pol len data con firmed the pic ture of the postglacial veg e ta tion changes of the Wigry Na tional Park, which was based on ear lier stud ies of Lake Wigry. Fur ther more, it doc u mented the ex is tence, mainly in the Preboreal and At -lan tic chronozones, of tem po rary changes in veg e ta tion, which might be a re ac tion to a short-lived cold fluc tu a tions of cli mate.
Key words: postglacial suc ces sion of veg e ta tion, palaeo eco logi cal re con struc tion, cli mate changes, Late Gla cial,
Ho lo cene, pol len anal y sis, Wigry Na tional Park, NE Po land
Manuscript received 5 September 2013, accepted 6 May 2014
IN TRO DUC TION
The de gree of knowl edge on postglacial veg e ta tion de
vel op ment in the Suwa³ki re gion, as for the en tire northeast
-ern Po land, is still not sat is fac tory (Ralska-Jasiewiczowa et
al., 2004, Kupryjanowicz 2008). The palaeobotanical re
-search in this area started in the first half of the 20
thcen tury
(Osinki I and II, Krzywe, Suchar Dembowskich, Zak¹ty –
O³tuszewski 1937), and then con tin ued in the sec ond half of
this cen tury (Krusznik – Stasiak 1971), how ever, from the
point of view of con tem po rary stan dards of palaeo eco logi cal
re searches, all of these stud ies are only of his tor i cal value.
Solely the re
sults of re
cent palaeobotanical stud
ies con
-ducted in the last de cade, which have been sup ported by
many ad di tional palaeo eco logi cal an a lyzes, can be used to
carry out the mod ern palaeo eco logi cal re con struc tions (Lake
Wigry – Kupryjanowicz 2007, Kupryjanowicz and
Juroch-nik 2009, Rutkowski and Krzysztofiak 2009; Lake Hañcza –
Lauterbach et al., 2010; Lake Szurpi³y – Tylmann et al.,
2011; Lake Linówek – Ga³ka and Tobolski 2013). Even
these, how ever, do not pro vide a com plete pic ture of the
changes. The pro file from Lake Wigry – the larg est wa ter
body in the Wigry Na tional Park, while it al lowed to re con
-struct the main stages of postglacial suc ces sion of veg e ta tion
in the re gion (Kupryjanowicz 2007), yet for the Late Gla cial
and Early Ho lo cene pro vided a very low res o lu tion of the re
-cord of en vi ron men tal changes (ev ery 200–300 years). In the
pro file from Lake Szurpi³y, the biogenic sed i men ta tion was
in ter rupted at the be gin ning of the At lan tic pe riod by the ac
-cu mu la tion of a thick (about 1 m) layer of sand not con tain ing
pol len (Tylmann et al., 2011). In the pro
file from Lake
Hañcza there is a sed i men ta tion hi a tus, cov er ing al most
whole the mid dle Ho lo cene (Lauterbach et al., 2010). There
-fore, fur ther stud ies are needed to com ple ment the ex ist ing
de fi cien cies.
From few years the De part ment of Bot any at the Uni ver
-sity of Bialystok has been con duct ing an in ter dis ci plin ary
palaeo eco logi cal re search of sev eral dystrophic lakes lo cated
within the Wigry Na tional Park (Drzymulska and
Kupryja-nowicz 2012, Drzymulska 2012, Drzymulska et al., 2013a,
b, c, Fi³oc 2013a, b, Fi³oc and Kupryjanowicz 2013a, b). The
study in cludes a lot of as pects of the his tory of the ex am ined
lakes. A part of the pro ject is a pol len anal y sis of sed i ments
from three wa ter bod ies – Lake Œlepe, Lake Suchar Wielki
and Lake Suchar II. Its main pur pose is to re con struct the
veg e ta tion changes both around and within stud ied wa ter
bod ies un der the in flu ence of the cli mate changes that have
been tak ing place over the last ca. 12 thou sand years. In this
pa per we pre sented the pre lim i nary re sults of these stud ies,
which made it pos si ble to re con struct the main stages of veg
-e ta tion d-e v-el op m-ent in th-e Wigry Na tional Park dur ing th-e
Late Gla cial of Vistulian and the Ho lo cene. These data were
con fronted with the prior knowl edge of the post gla cial veg e
-ta tion de vel op ment in the Suwa³ki re gion.
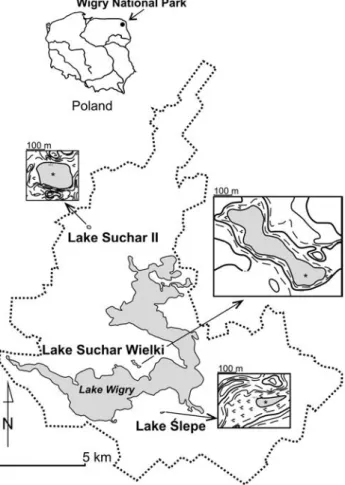
STUDY AREA
Lake Œlepe (LS), Lake Suchar II (LSII), and Lake Suchar
Wielki (LSW) are lo
cated in the Wigry Na
tional Park
(WNP), northeast ern Po land (Fig. 1). The two phys i calgeo
-graph ical mesoregions, the East Suwa³ki Lakeland and the
Augustów Up land, oc cur in this part of Po land, and both are
in cluded in the Lith u a nian Lakeland (Kondracki 1994). The
ter rain of this area was shaped dur ing the Pom er a nian phase
of the main stadial of the Vistula Gla ci ation (Marks 2002).
The cli mate of this area is tem per ate tran si tional with a ten
-dency to ward con ti nen tal. This area is char ac ter ized by the
most se vere cli ma tic con di tions across the low land parts of
the coun try (Krzysztofiak and Olszewski 1999). Not far from
the Wigry Na tional Park there are the range lim its of many
plant spe cies, mainly trees (e.g. Picea abies, Taxus baccata,
Acer pseudoplatanus, Quercus sessilis, Fagus sylvatica),
shrubs (e.g. Salix lapponum) and dwarf shrubs (e.g. Rubus
chamaemorus) (Szafer and Zarzycki 1977). These all plants
oc cur here on the bor der of their eco log i cal tol er ance.
METH ODS
Field works
The drill ing in deep spots of all the lakes was car ried out
us ing the Wiêckowski’s probe with a length of 110 cm and a
di am e ter of 5 cm. Cores of bot tom sed i ments with the thick
-ness of 9.60 m (Lake Suchar Wielki), 5.95 m (Lake Suchar
II) and 5.18 m (Lake Œlepe) were col lected. It was nec es sary
to sup ple ment the col lected pro files with top lay ers of highly
liq ue fied sed i ments that could not be col lected with a
Wiêc-kowski’s probe. The miss ing sed i ments from Lake Suchar
Wielki – 0.50 m and from Lake Œlepe – 0.23 m were col lected
us ing the Kajak probe. The sed i ments from Lake Suchar II
were not col lected yet.
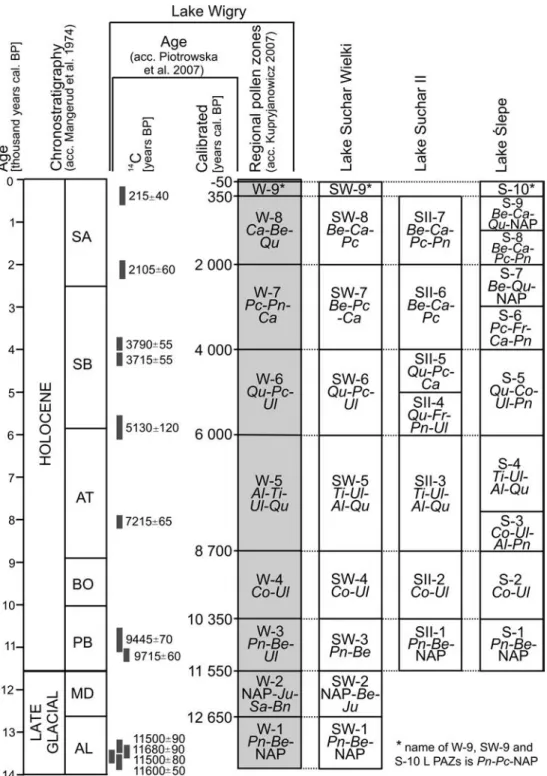
Age of sed i ments
The age of the 4 sam ples of sed i ments from Lake Suchar
Wielki and 1 sam ple of sed i ments from Lake Suchar II was
de ter mined by AMS ra dio car bon method (Tab. 1). OxCal
4.2.3 on line soft ware (Bronk Ramsey 2009) was used to cal i
-brate the ra dio car bon age of the sam ples. Due to a very small
num ber of ra dio car bon age de ter mi na tions in the stud ied pro
-files, the chro nol ogy of events re corded in these pro files has
been de ter mined also in di rectly, based on a sim i lar ity be
tween pol len spec tra with the ra dio met ri cally welldated pro
-file from the nearby Lake Wigry (Kupryjanowicz 2007). The
age of the sed i ments de ter mined thus was com pared with
AMS ra dio car bon dat ing (Fig. 2).
Fig. 1. Lo ca tion of stud ied lakes. * – places of the corings.
Ta ble 1
Ra dio car bon dat ing of the an a lyzed sed i ments.
Core Depth [m] Dated material Age 14C (yrs BP)Cal i brated age (cal.yrs BP) range 68.2% range 95.4% SW 10.42 plant re mains 3,170±25 3,443–3,404 3,449–3,359 SW 13.82 sed i ment 7,820±35 8,629–8,560 8,704–8,521 SW 15.02 plant re mains 8,560±50 9,550–9,495 9,627–9,470 SW 15.74 sed i ment 9,640±45 11,172–10,827 11,189–10,785
SII 12.17 sed i ment 10,120±30 11,916–11,626 11,987–11,508
SW – Lake Suchar Wielki, SII – Lake Suchar II
Ta ble 2
Li thol ogy of an a lyzed pro files. Depths are counted from
the wa ter sur face
Depth [m] Sed i ment de scrip tion Lake Suchar Wielki
7.57–16.74 dy
16.74–16.77 sand with shells 16.77–16.80 fine-de tri tus gyttja 16.80–16.86 sand with shells 16.86–16.94 cal car e ous gyttja 16.94–17.06 clay with sand
Lake Suchar II
6.50–12.20 dy
12.20–12.32 silt
12.32–12.42 peat-like sed i ment 12.42–12.51 sand with shells and gravel
12.51–12.55 silt
12.55–12.60 sand with shells and gravel Lake Œlepe
0.75–5.73 dy
5.73–5.80 silt
5.80–6.23 sand with shells and gravel
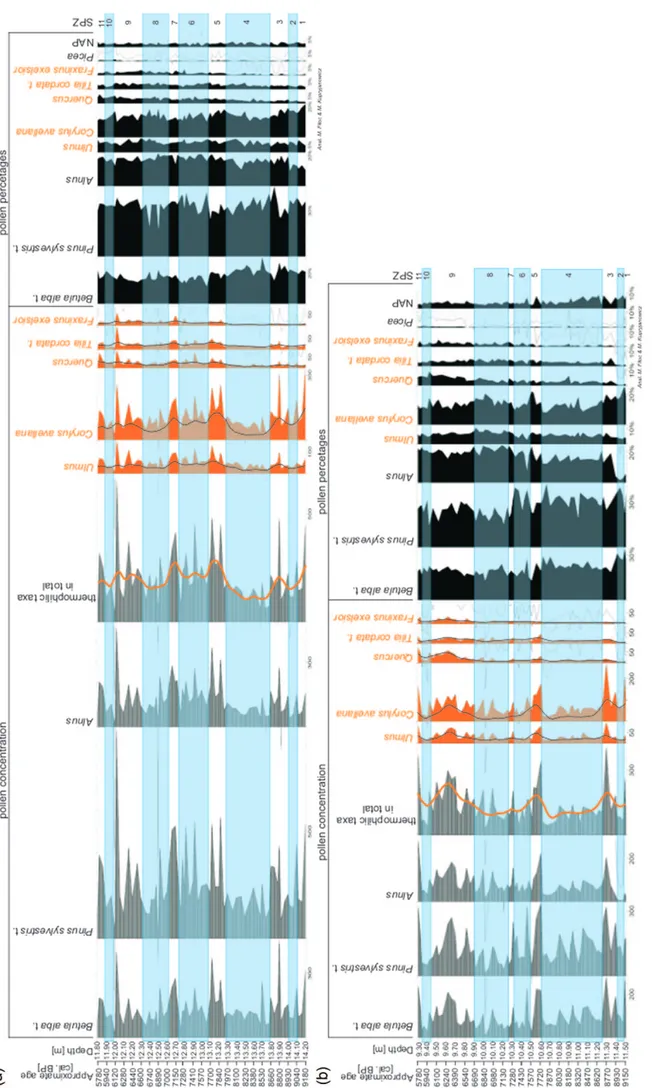
Pol len anal y sis
Sam ples for pol len anal y sis were taken ev ery 2 cm. The
sam ples were sub ject to mac er a tion ap ply ing the method of
Erdtman’s acetolysis (Faegri and Iversen 1975). The prep a
-ra tion of the sam ples and their mi cro scopic anal y sis were
car ried out in ac cor dance with the stan dard pro ce dure
(Berg-lund and Ralska-Jasiewiczowa 1986).
In each sam ple, at least 500 sporomorphs were counted.
Pol len and spores were iden ti fied us ing sev eral keys (e.g.
Moor et al., 1991; Beug 2004). The per cent age value of each
pol len taxon has been cal cu lated in re la tion to the to tal sum of
trees and shrubs pol len (AP) and her ba ceous plants pol len
(NAP), ex clud ing pol len of lo cal plants, limnophytes and
telmatophytes. The re sults are pre sented as per cent age pol len
di a grams pre pared with POLPAL 2004 ver. 2011 soft ware
(Walanus and Nalepka 1999; Nalepka and Walanus 2003).
The di a grams were di vided into lo cal pol len as sem blage
zones (L PAZ) (Figs 3–5) with the use of CONISS
(POLPAL) ap pli ca tion re sults.
RE SULTS
The an a lyzed cores had been shortly de scribed dur ing
the field works, and then com pleted af ter clean ing them in the
lab o ra tory (Tab. 2).
LATE GLA CIAL AND HO LO CENE VEG E TA TION CHANGES
7
Ta ble 3
Char ac ter iza tion of the lo cal pol len as sem blage zones (L PAZ) dis tin guished in the an a lyzed pro files
Sym bol and name Depth [m] De scrip tion of pol len spec traLake Suchar Wielki SW-1
Pinus-Betula-NAP 16.90–16.45
Dom i na tion of Pinus sylvestris t. (53–86%); high val ues of Betula alba t. (6–33%), rise of NAP pro por tion to 12%; max i mum of Salix (2%); still pres ence of Juniperus communis.
SW-2
NAP-Betula-Juniperus 16.45–15.95
Max i mum of NAP (27%) rep re sented mainly by Ar te mi sia (8–16%), and Juniperus communis (8%); in -crease of Betula alba t. to ca. 45%; de pres sion of Pinus sylvestris t. (22%); low-per cent age cul mi na tion of
Picea abies t. (3%) in the top.
SW-3
Pinus-Betula 15.95–14.65
Dom i na tion of Pinus sylvestris t. (36–64%) and Betula alba t. (29–58%); start of con tin u ous curves of
Ulmus and Corylus avellana and their grad ual in crease to 4% and 5%, re spec tively; rather high NAP pro
-por tion (3–6%) and Salix (to 1%). SW-4
Corylus-Ulmus 14.65–14.25
Max i mum of Corylus avellana (22%); rel a tively high pro por tion of Ulmus (ca. 6%); rise of Alnus to ca. 6%; start of con tin u ous curves of Tilia cordata t., Quercus and Fraxinus ex cel sior.
SW-5
Tilia-Ulmus-Alnus-Quercus 14.25–11.55
Max i mum of Tilia cordata t. (5%), Ulmus (9%), Alnus (22%) and Fraxinus ex cel sior (4%); sys tem atic in -crease of Quercus to 8%; Corylus avellana slightly lower than pre vi ous zone; still pres ence of Picea abies t.
SW-6
Quercus-Picea-Ulmus 11.55–10.55
Max i mum of Quercus (13%); rel a tively high val ues of Fraxinus ex cel sior (ca. 3%) and Corylus avellana; grad ual rise of Picea abies t. to 3%; start of Carpinus betulus con tin u ous curve; de crease of Alnus to 16%,
Tilia cordata t. to 1% and Ulmus to 2%.
SW-7
Betula-Picea-Carpinus 10.55–9.45
Sig nif i cant rise of Betula alba t. (to 38%); slight in crease of Carpinus betulus (to 3%); rel a tively high pro -por tion of Corylus avellana (6–12%), Quercus (4–8%) and Tilia cordata t. (1–2%); rise of NAP to 4%.
SW-8
Betula-Carpinus-Picea 9.45–8.25
High per cent age of Betula alba t. (28–39%); rel a tively high val ues of Carpinus betulus with two peaks (5% and 6%) as well as Quercus (4–8%); Corylus avellana lower than pre vi ous zone (ca. 3%); still pres ence of
Picea abies t. (1–4%); de crease of Alnus to 8%; very low pro por tion of Ulmus, Tilia cordata t. and Fraxinus ex cel sior; NAP slightly lower than pre vi ous zone.
SW-9
Pinus-Picea-NAP 8.25–7.57
High val ues of Pinus sylvestris t. (35–48%) and NAP (4–18%), in clud ing cul ti vated plants as Cerealia t.,
Fagopyrum and Can na bis sativa cf., as well as few hu man in di ca tors as Rumex acetosella t., Plantago lanceolata, Ar te mi sia, Poaceae and Chenopodiaceae; rel a tively high pro por tion of Picea abies t. (2–5%);
de cline of all other trees and shrubs. Lake Suchar II
SII-1
Pinus-Betula-NAP 12.60–11.85
Dom i na tion of Pinus sylvestris t. (44–80%), and next of Betula alba t. (to 77%); high pro por tion of NAP (6–11%); start of con tin u ous curves of Ulmus, Corylus avellana and Alnus in the top part of the zone; pres ence of Corylus avellana, Alnus, Ulmus, Quercus and Tilia cordata t. in the bot tom part – prob a bly in sec -ond ary bed.
SII-2
Corylus-Ulmus 11.85–11.35
Max i mum of Corylus avellana (25%); rel a tively high pro por tion of Ulmus (ca. 6%); rise of Alnus from 2% to 5%; start of con tin u ous curves of Tilia cordata t., Quercus, Fraxinus ex cel sior and Picea abies t.
SII-3
Tilia-Ulmus-Alnus-Quercus 11.35–9.35
Cul mi na tions of Tilia cordata t. (2–5%), Ulmus (5–11%) and Alnus (to 24%); sys tem atic rise of Quercus (1–7%) and Fraxinus ex cel sior (1–5%); val ues of Corylus avellana slightly low than pre vi ous zone (10–22%).
SII-4
Quercus-Fraxinus-Pinus-Ul mus
9.35–8.75
Max i mum of Quercus (10%); rel a tively high val ues of Fraxinus ex cel sior (2–4%); in crease of Pinus
sylvestris t. to ca. 37%; small rise of Picea abies t.; still fairly high val ues of Corylus avellana (10–15%);
fall of Tilia cordata t. (to 2%) and Ulmus (to 3%).
SII-5
Quercus-Picea-Carpinus 8.75–7.85
Rise of Picea abies t. to ca. 5%; rel a tively high pro por tion of Quercus (ca. 9%) and Corylus avellana (6–14%); start of Carpinus betulus con tin u ous curve; slight in crease of Betula alba t. (to 27%); de crease of
Tilia cordata t. (to 1%), Ulmus (to 1%) and Fraxinus ex cel sior (to 1%).
SII-6
Betula-Carpinus-Picea 7.85–7.35
In crease of Betula alba t. to 35%, Carpinus betulus to 4% and NAP to 6%; rel a tively high val ues of Picea
abies t. (to 4%), Quercus (to 8%) and Pinus sylvestris t. (to 31%); pro por tion of Corylus avellana much
lower than pre vi ous zone (5–6%); fall of Alnus, Ulmus, Tilia cordata t. and Fraxinus ex cel sior. SII-7
Betula-Carpinus-Picea-Pin us
7.35–6.65
Max i mum of Carpinus betulus (5%); in crease of Pinus sylvestris t. to ca. 43%; rel a tively high val ues of
Picea abies t. (4%), Betula alba t. (33%), Quercus (7%) and NAP (7%); low-per cent age cul mi na tion of Salix; de cline of all other trees and shrubs.
Lake Œlepe S-1
Pinus-Betula-NAP 5.60–5.35
At first peak of Betula alba t. (45%), and then Pinus sylvestris t. (53%); rel a tively high NAP val ues (4–8%); ris ing val ues of Ulmus and Corylus avellana; pres ence of Salix, Alnus and Quercus.
S-2
Corylus-Ulmus 5.35–5.05
Max i mum of Corylus avellana (27%); high per cent ages of Betula alba t. (35%); rel a tively high pro por tion of Ulmus (ca. 8%); de pres sion of Pinus sylvestris t. (22–30%); rise of Alnus to 6% and Quercus to 2%; start
Tilia cordata t. con tin u ous pol len curve.
S-3
Corylus-Ulmus-Alnus-Pinus 5.05–4.65
Two peaks of Pinus sylvestris t. (45% and 40%); de pres sion of Corylus avellana (15–21%) and Ulmus (5%); Betula alba t. lower than pre vi ous zone (18–25%); in crease of Alnus to 20%, Tilia cordata t. to 3% and Quercus to 2%.
S-4
Tilia-Ulmus-Alnus-Quercus 4.65–3.55
Max i mum of Tilia cordata t. (7%), Ulmus (9%), Alnus (30%) and Salix (3%); in crease of Quercus to 8% and Fraxinus ex cel sior to 4%; Pinus sylvestris t. lower than pre vi ous zone (14–29%); Betula alba t. os cil lat -ing around 13–30%, and Corylus avellana around 10–19%.
S-5
Quercus-Corylus-Ulmus-Pinus
3.55–3.15
Max i mum of Quercus (14%); two peaks of Corylus avellana (21% and 18%) and Pinus sylvestris t. (28% and 33%); still quite high val ues of Ulmus (2-6%); con tin u ous oc cur rence of Picea abies t. and Carpinus
In the sim pli fied pol len di a grams, 9 lo cal pol len
assem-blage zones were dis tin guished for Lake Suchar Wielki (Fig. 3),
7 for Lake Suchar II (Fig. 4) and 10 for Lake Œlepe (Fig. 5).
Their short char ac ter is tics are showed in Ta ble 3.
DIS CUS SION – RE CON STRUC TION
OF VEG E TA TION CHANGES
Late Gla cial
AllerÝd interstadial (ca. 13350–12650 cal. years BP
ac cord ing to Ralska-Jasiewiczowa et al., 1999 and Litt et al.,
2001) is rep re sented only in pol len pro file from Lake Suchar
Wielki (SW-1 Pinus-Betula-NAP L PAZ – Fig. 3). The
palynological re cord shows the dom i nance of the for est with
a strong pre dom i nance of pine (Pinus sylvestris t. pol len) and
the pres ence of open com mu ni ties with grasses and other
herbs (Ar te mi sia, Chenopodiaceae Apiaceae, Thalictrum,
Cichoriaceae) as well as shrub com mu ni ties of ju ni per
(Juni-perus communis), dwarf birch (Betula nana t. pol len) and
shrubby wil
lows (pol
len of Salix pentandra t., Salix cf.
herbacea).
Youn ger Dryas stadial (ca. 12650–11550 cal. years BP
ac cord ing to Ralska-Jasiewiczowa et al., 1999 and Litt et al.,
2001) like the pre vi ous pe riod, is rep re sented only in the pol
-len pro file from Lake Suchar Wielki (SW-2
NAP-Betula-Juniperus L PAZ – Fig. 3). The palynological re cord shows a
sig nif i cant in crease in the acre age of open com mu ni ties (max i
-mum of her ba ceous plants in the pol len re cord), re spond ing to
the cli mate cool ing. The max i mum spread of mugwort (Ar te
-mi sia), goosefoot (Chenopodiaceae), and ju ni per (Juniperus)
sug gests not only the drop in tem per a ture, but also a sig nif i
-cant re duc tion in mois ture (Ralska-Jasiewiczowa et al., 1998).
The veg e ta tion was of a mo saic na ture with patches of shrubby
tun dra formed mainly by dwarf birch (Betula nana t. pol len)
and shrubby wil lows (pol len of Salix pentandra t. and Salix
undiff.) in wet places and patches of ju ni per (Juniperus
com-munis) and steppe grass lands in dry hab i tats.
The pol len of pine (Pinus sylvestris t.) and of woody
birch (Betula alba t.), which dom i nates the pol len spec tra,
could have come from a long dis tant trans port, al though one
can not rule out the pres ence of small clus ters of trees among
her ba ceous and shrubby veg e ta tion. The con tin u ous pol len
curve of Picea abies t. in the up per part of the SW-2 pol len
zone may sug gest that in the mean time spruce was pres ent in
the Wigry re gion – as its quite heavy pol len grains are not
trans ported over long dis tances. Pol len data from northeast
-ern Po land (Ga³ka et al., 2013) and Lith u a nia (StanèikaitÅ et
al., 2002) con firm that spruce was pres ent at that time in
north east ern part of Cen tral Eu rope. Such an early pres ence
of spruce in this area was most likely as so ci ated with the
spread of Si be rian spruce (Picea obovata) from its gla cial
refugia lo cated in west ern Rus sia (Hunt ley and Birks 1983;
Terhürne-Berson 2005; Lata³owa and van der Knapp 2006).
Ho lo cene
Preboreal chronozone (ca. 11550–10350 cal. years BP
ac cord ing to Mangerud et al., 1974 and Walanus and
Nalepka 2010) con tained the ini tial stage of Ho lo cene for est de
-vel op ment. It is rep re sented in all an a lyzed pro files (SW-3
Pinus-Betula L PAZ – Fig. 3, SII-1 Pinus-Betula-NAP L
PAZ – Fig. 4, S-1 Pinus-Betula-NAP L PAZ – Fig. 5). The
cli mate warm ing at the tran si tion be tween the Late Gla cial
and the Ho lo cene, have lim ited the area of open plant com
-mu ni ties. This is par tic u larly vis i ble in the de cline of
Juniperus com munis and her ba ceous plants pol len and the sig nif
-i cant -in crease -in the per cent age of pol len of P-inus sylvestr-is t.
and Betula alba t. pol len. The veg e ta tion that dom i nated the
Wigry re gion all that time were for est with a pre dom i nance
of pine and a large share of birch. In the sec ond part of the
Preboreal pe riod, from about 11000 cal. years BP, first trees
and shrubs with a more de mand ing cli ma tic con di tions, such
as elm (Ulmus) and ha zel (Corylus avellana), could have
reached this area. This is doc u mented by the be gin ning of the
con tin u ous curves of pol len of both taxa.
The most de vel oped pol len re cord of this pe riod is reg is
-tered in the pro file from Lake Suchar Wielki, in which it is
rep re sented by the SW-3 Pinus-Betula pol len zone. There is
a sig nif i cant prob a bil ity that the mid dle part of this zone,
LATE GLA CIAL AND HO LO CENE VEG E TA TION CHANGES
9
Ta ble 3 continued
Sym bol and name Depth [m] De scrip tion of pol len spec tra Lake Œlepe
S-6
Picea-Fraxinus-Carpinus-Pinus
3.15–2.65 Cul mi na tions of Picea abies t. (4%), Carpinus betulus (3%), Fraxinus ex cel sior (4%) and Pinus sylvestris t. (37%); de pres sion of Quercus (6%); fall of Corylus avellana to 6%, Ulmus to 1% and Tilia cordata t. to 1%.
S-7
Betula-Quercus-NAP 2.65–2.25
Rise of Betula alba t. to 33%; small peak of Quercus (10%); NAP cul mi na tion (3–6%); de pres sions of Pinus
sylvestris t. (ca. 26%), Picea abies t. (ca. 1%) and Carpinus betulus (2%); de crease of Corylus avellana to
3%. S-8
Betula-Carpinus-Picea-Pinus
2.25–1.45
Very high pro por tion of Betula alba t. (26–34%); rel a tively high val ues of Carpinus betulus (3–5%); cul mi -na tion of Pinus sylvestris t. (29–42%) and Picea abies t. (1–3%); de cline of Alnus, Corylus avella-na, Ulmus,
Tilia cordata t. and Fraxinus ex cel sior; NAP lower than pre vi ous zone.
S-9
Betula-Carpinus-Quercus-NAP
1.45–0.95
Cul mi na tions of Betula alba t. (34–41%), Carpinus betulus (2–7%), Quercus (3–9%) and Alnus (10–17%); mean ing in crease of NAP (4–20%), in clud ing cul ti vated plants as Cerealia t., Fagopyrum and Can na bis
sativa cf., as well as few hu man in di ca tors as Rumex acetosella t., Plantago lanceolata, Ar te mi sia, Poaceae
and Chenopodiaceae; de pres sion of Pinus sylvestris t. (19-30%); still pres ence of Salix; very low pro por tion of all other trees and shrubs.
S-10
Pinus-Picea-NAP 0.95–0.75
Very high val ues of NAP (9–18%); rise of Pinus sylvestris t. to 49% and Picea abies t. to 3%; de cline of
Betula alba t. to 20%, Carpinus betulus to 1%, Quercus to 2% and Alnus to 7%; very low per cent ages of all
. 3 . gi F d ur e g na M . cc a( se n oz o n or h C . i kl ei W r a hc u S e ka L eli f or p e ht m or f ) a xa t de tc e l es f o se vr uc yl n o( ma r g a i d ne ll o p e g a t ne cr e p de i fi l p mi S .l a t e re ll A – L A : ) 4 7 9 1 , Ý ,s a yr D r e g n u o Y – D Y , d .c it na lt a b u S – A S , la er o b b u S – B S , ci t na lt A – T A , la e r o B – O B , la er o be r P – B P
LATE GLA CIAL AND HO LO CENE VEG E TA TION CHANGES
11
. 4 . gi F . 3 . gi F ni sa s n oi t a na l p x E . II ra hc u S e ka L eli f or p e ht m or f )a xa t de tc e l es f o se vr uc yl n o( ma r g a i d ne ll o p e g a t ne cr e p de i fi l p mi S. 5 . gi F . 3 . gi F ni sa s n oi t a na l p x E . e pe l Πe ka L eli f or p e ht m or f )a xa t de tc e l es f o se vr uc yl n o( ma r g a i d ne ll o p e g a t ne cr e p de i fi l p mi S