ELEMINATION OF WASTE IN PRODUCTION
ENTERPRISES – CASE STUDIES
Barbara Chomątowska* and Agnieszka Żarczyńska- Dobiesz**
* Department of Production and Work Management, University of Economics, Wroclaw, 53-345, Poland, Email: barbara.chomatowska@ue.wroc.pl
** Department of Production and Work Management, University of Economics, Wroclaw, 53-345, Poland, Email:agnieszka.zarczynska@ue.wroc.pl
Abstract The article aims to show, based on the example of two production companies, how businesses these days can efficiently and effectively improve their processes using simple and low-cost waste elimination method of kaizen.
Paper type: Research Paper Published online: 30 April 2014
Vol. 4, No. 2, pp. 157-166 ISSN 2083-4942 (Print) ISSN 2083-4950 (Online)
© 2014 Poznan University of Technology. All rights reserved. Keywords: kaizen, waste, muda
1. INTRODUCTION
"We only analyze the timeline - from the moment the customer gives us the order
until when we receive payment. We shorten the time by removing all losses - activities that do not add value" (T. Ohno)
Almost every organization these days is looking for new methods and manage-ment tools that provide effective and efficient implemanage-mentation of its assumed objectives. The selection of the right methods and management tools is conditioned by many factors. Among other things it requires respective competences of managers, precise knowledge of industry characteristics, the market position of the company as well as its financial standing.
Especially during economic slowdown managers look for low-cost solutions that can lead to big changes bringing about improved quality, lower costs and timely delivery (Imai, 2006, p. 14). These needs can be addressed by kaizen and many simple methods to achieve this philosophy, such as waste elimination.
The purpose of this article is to show how the two companies have raised pro-duction efficiency and effectiveness of their activities through identification and elimination of waste in their processes. This article is based on literature and authors' experience of working with business practice in the management of production and services, logistics (The case studies presented in the article include only a general description of the business situation due to sensitive character of obtained infor-mation and lack of consent to provide detailed description.).
2. NATURE AND TYPES OF WASTE
The production process is a set of activities that transform raw materials into finished products. In any process the human and material resources either add value or do not add value to the product. Activities that do not add value to the product are referred to as waste (muda in Japanese) (Imai, 2006, p. 115). They comprise all useless and unnecessary activities and unwise use of resources needed to achieve production targets.Womack and Jones describe waste as any human activity that absorbs resources but creates or adds no value to the process (Womack & Jones, 2003, p. 15).Hence muda includes:
• Defects in need of repair,
• Production of goods that nobody wants, resulting in rising stocks and piles of unsellable goods,
• Phases of technological processes, which in fact are not needed,
• Movement of workers and goods from place to place, without any order, • Workers down the line standing idle and waiting, because the previous
• Goods and services that do not meet customers‘ expectations (Womack & Jo-nes, 2001, p. 49).
There are eight basic types of muda distinguished in the literature (Liker & Meier 2011, pp. 62-63), (Imai, 2006, pp. 115-121), (Rother & Shook, 2009, pp. 50-51): 1. Overproduction – producing "for stock" despite the lack of actual demand from
customer leads to the accumulation of excess inventories in the later stages of the production process and ultimately to increased costs,
2. Waiting (extra time) – occurs when an operator stays idle due to: unbalanced production line, machine breakdown, and when the worker is just observing the operating machine that is adding value,
3. Transport or movement – is a necessary part of the operation, but the transfer of materials, components or finished products to and from warehouses, or between processes does not add any value,
4. Over-processing or incorrect processing – consists in performing unnecessary steps in the processing of products, inefficient processing due to poor tools and imperfect product design, making it necessary to perform unnecessary movements and resulting with defects. We generate waste when provide products of higher quality than required. Sometimes this extra "work" is done just to fill extra time and not to wait idle,
5. Excess inventory – finished products, semi-finished products kept in stock do not add any value. Excess raw materials, work in progress or finished products extend the products lead time, increase product aging and damage, increase transport and storage costs and delay delivery. Excessive stocks hide problems such as unleveled production, delayed deliveries from suppliers, defects, equip-ment downtime, etc.,
6. Waste movement – all moves that workers must perform in the course of work which do not add value, such as reaching for something, looking for something, deposition of parts and tools, etc. Walking from one place to another is also a loss, 7. Defects, repairs – producing products with defects or the need to remove these defects, production of substitutes and control - all these require additional work, time and effort,
8. Unused creativity of workers – losing time, ideas, skills, improvements and opportunities to learn as a result of non-alignment of workers and not listening to them.
According to T. Ohno the major source of waste is overproduction because it is the cause of all the other types of waste. Producing much in advance or producing more than that customers demands in every phase of the production process inevitably leads to the accumulation of excess inventory somewhere in the later stage of the process. The accumulated materials stay and wait to be processed in the next operation. It should be noted that the main reason why Ohno considered the first seven types of waste as so important is their impact on what is called the eighth type of waste. Overproduction, excess inventory, etc. hide core problems and do not force employees to think. Reducing wastes highlights that problems
making them evident and forces employees to be creative in order to solve them (Liker & Meier, 2011, p. 63). When faced waste the most desired solution is its identification and elimination.
3. CASE STUDIES
The following studies show how two production companies applied waste identification and waste elimination to improve their processes. In the first case of company X the successful elimination of muda in the process of packing triggered implementation of kaizen philosophy across the whole organization. The other case of company Y, which has been practicing kaizen for many years, presents how the company identified and eliminated waste in another important area of business.
3.1. Case study No. 1
Company X is a medium-sized manufacturing and service enterprise founded and operating in Lower Silesia (region in the south west of Poland). For the last two years the company has been recording an increase in the level of dissatisfaction of customers who have been complaining more and more often about receiving damaged or soiled products they ordered. As it turned out the problem rest in the pro-duct packaging process. A task teem was set up to identify and solve the problem.
The company uses three distribution channels: • Shipping by courier,
• Own transport,
• Personal collection by customer.
The most frequently used channel is the shipping by courier, mostly due to short delivery time. Approximately 70-80% of orders for standard products assembled until 10 AM are delivered the same day.
Production department stops at 2 PM. One hour before the end of work of the department the products are dispatched to sales department (located several kilometers from the production facility). Until investigation the processed goods were packed into thin plastic bags which were tied in knots. It was a sufficient protection for products that were stocked or delivered to customers by their own means of transport. However, in the case deliveries via courier the products required additional protection. To make sure the products reached customers undamaged and clean they were additionally wrapped with stretch film and the pack edges were secured with a tape. The product was prepared for shipment by one of production employees who walked away from his work area to handle packing and shipping. This work arrangement was an obvious waste for the task team who analyzed the process.
The solution to the above consisted in ordering stronger plastic bags of reinforced structure and increased gram weight. This enabled the finished products to be packed immediately after they exit the machine in a packaging that protects its quality during transport via courier. Machine operators do not have to walk away from their work areas to handle additional packing of the product before shipment.
The downside of the new solution is a much higher cost of a thicker film. The next objective was to minimize the length of film used for each packing. To date, the plastic bags were tied into knots at both ends. This required large additional lengths of film to be spared to tie the knots but the lengths were cut off and discarded after fastening. It was observed that employees quite frequently trimmed the film sleeve too short and then were unable to tie knots at both ends of the packaged product hence the plastic sleeve became useless. This point was solved through the use of cable ties which not only reduced the consumption of plastic sleeve, but also significantly improved the aesthetics of the finished product packaging.
The improvements had a very positive impact on the orders shipment process. They helped eliminate the extra phase of packaging that had no added value for the customer. The customer did not value the number of layers of film used in packaging but the quality of the product and the fact that it is clean and damage free. Although there appeared new categories of costs associated with the purchase of stronger plastic sleeve and cable ties, the company saves considerably on the stretch film and plastic sleeve orders. The change brought in noticeable results in a short time. The new optimal gram weight of plastic film was worked out in consultation with the customers and the film suppliers and today the discussed packaging format has become the company’s standard.
3.2. Case study No. 2
Company Y is a large manufacturing company that specializes in the production of welded steel structures primarily for the automotive industry. Its activity is based on the foundations laid down as House Values of Y Company, whose in-tegral element is, among the others, the elimination of muda.
The continuous improvement focus helped the company identify the paint shop as the problem area that generated excessive costs. In attempt to solve the problem it was decided to identify and eliminate waste in the paining process. In order to collect the data needed to diagnose and solve problems occurring in the process, the snapshot observation method was applied. The first step was to write down all tasks that em-ployees perform in the given position, and classify them into activities that add value to the product, the necessary steps that do not add value and pure waste activities.
Table 1 List of operations performed at the position of suspending parts before painting
along with the number of occurrences in a given observation time and waste classification; Source: internal materials of Company Y.
No Activity Occurance
No.
Occurance rate [%]
Waste/Muda classification
1 Suspending 604 28,52 Adding Value
2 Securing 451 21,29 Necessary Non Adding Value
3 Remove paint from covering jigs 58 2,74 Muda: Overprocessing
4 Grouping items 105 4,96 Necessary Non Adding Value
5 Selection of suspending jigs 40 1,89 Necessary Non Adding Value
6 Productiuon orders processing 40 1,89 Necessary Non Adding Value
7 Planned downtime 177 8,36 Necessary Non Adding Value
8 Cleaning the position 70 3,31 Necessary Non Adding Value
9 Help to another worker 3 0,14 Necessary Non Adding Value
10 Talking 68 3,21 Muda:Excessive movement
11 Walking around the position 96 4,53 Muda: Excessive movement
12 Waiting 46 2,17 Muda: Waiting
13 Leaving the position 103 4,86 Muda: Excessive movement
14 Internal transportation 130 6,14 Muda: Excessive transport
15 Cleaning items (grinding) 69 3,26 Muda: Overprocessing
16 Relocating items 52 2,46 Muda: Overprocessing
17 Line speed set up 3 0,14 Necessary Non Adding Value
The painting line consists of three positions: the position were parts are sus-pended prior to painting, the position of coating and the position where parts are removed after painting. Tables 1-3 show all activities performed on these positions, along with the total number of occurrence in one shift (8 hours) and the classifica-tion of the activities into groups: the activities that add value, necessary but not value adding and no added value activities.
Table 2 List of operations performed at the position of painting along with the number
of occurrences in a given observation time and waste classification; Source: internal materials of Company Y. No Activity Occurance No. Occurance rate [%] Waste/Muda classification
1 Painting 853 48,72 Adding Value
2 Thickness measurement 64 3,66 Necessary Non Adding Value
3 Colour change 138 7,88 Necessary Non Adding Value
4 Cleanig the position 4 0,23 Muda: Excessive movement
5 Planned downtime 0 0,00 Necessary Non Adding Value
7 Waiting for the moving item 231 13,19 Muda: Waiting
8 Help to another worker 3 0,17 Muda: Excessive movement
9 Talking 15 0,86 Muda: Excessive movement
10 Walking around the position 113 6,45 Muda: Excessive movement
11 Leaving the position 215 12,28 Muda: Excessive movement
12 Other 27 1,54 Muda: Other
13 Machine set up 35 2,00 Necessary Non Adding Value
14 Transport of paint 5 0,29 Necessary Non Adding Value
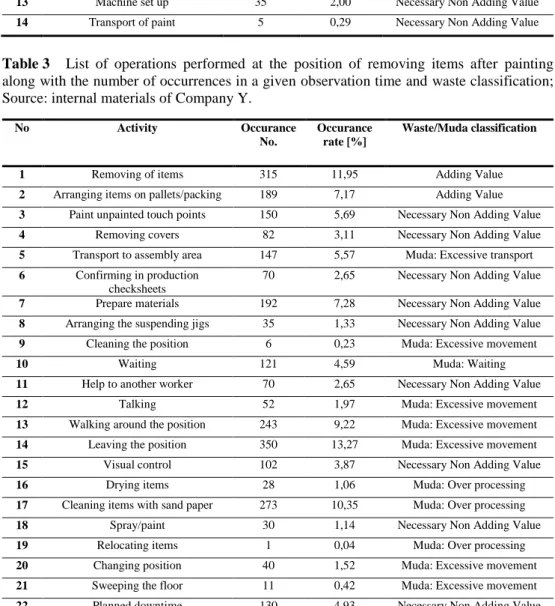
Table 3 List of operations performed at the position of removing items after painting
along with the number of occurrences in a given observation time and waste classification; Source: internal materials of Company Y.
No Activity Occurance
No.
Occurance rate [%]
Waste/Muda classification
1 Removing of items 315 11,95 Adding Value
2 Arranging items on pallets/packing 189 7,17 Adding Value
3 Paint unpainted touch points 150 5,69 Necessary Non Adding Value
4 Removing covers 82 3,11 Necessary Non Adding Value
5 Transport to assembly area 147 5,57 Muda: Excessive transport
6 Confirming in production
checksheets
70 2,65 Necessary Non Adding Value
7 Prepare materials 192 7,28 Necessary Non Adding Value
8 Arranging the suspending jigs 35 1,33 Necessary Non Adding Value
9 Cleaning the position 6 0,23 Muda: Excessive movement
10 Waiting 121 4,59 Muda: Waiting
11 Help to another worker 70 2,65 Necessary Non Adding Value
12 Talking 52 1,97 Muda: Excessive movement
13 Walking around the position 243 9,22 Muda: Excessive movement
14 Leaving the position 350 13,27 Muda: Excessive movement
15 Visual control 102 3,87 Necessary Non Adding Value
16 Drying items 28 1,06 Muda: Over processing
17 Cleaning items with sand paper 273 10,35 Muda: Over processing
18 Spray/paint 30 1,14 Necessary Non Adding Value
19 Relocating items 1 0,04 Muda: Over processing
20 Changing position 40 1,52 Muda: Excessive movement
21 Sweeping the floor 11 0,42 Muda: Excessive movement
22 Planned downtime 130 4,93 Necessary Non Adding Value
Tables 4-6 show quantities and percent rates of individual operations in suspending, painting and removing items.
Table 4 Quantities and percent rates of individual operations in the area of suspending;
Source: internal materials of Company Y. Measurements Number Adding Value
Operations
Necessary Non Adding Value
Muda
2112 (100%) 604 (28%) 886 (42%) 622 (30%)
Table 5 Quantities and percent rates of individual operations in the area of painting;
Source: internal materials of Company Y. Measurements
Number
Adding Value Operations
Necessary Non Adding Value
muda
1751 (100%) 901 (51%) 242 (14%) 608 (35%)
Table 6 Quantities and percent rates of individual operations in the area of removing items
after painting; Source: internal materials of Company Y. Measurements
Number
Adding Value Operations
Necessary Non Adding Value
muda
2637 (100%) 504 (20%) 861 (32%) 1272 (48%)
Having reviewed the above information the task team concluded that the area of removing items after painting is the largest source of muda/waste (48%). The big-gest waste contributors being: leaving the position, walking around the position, clea-ning parts with sandpaper and transportation to assembly area. A solution could be to create a separate position for painting unpainted touch points in the area of removing items after painting. It is important to provide all necessary tools and implement 5S standards in this position in order to properly maintain the work area and prevent the recurrence of muda. Cleaning parts with the use of sandpaper is associated with wrong suspending of items. In order to eliminate this muda it is recommended to introduce standards and work instructions describing proper ways of suspending for all elements. Transportation of items to assembly area cannot be avoided. However, one can minimize the time of this activity. Instead of tedious arranging of items on pallets it is recommended to introduce dedicated carts on which the items can be suspended.
In the area of suspending parts before painting muda accounted for 30% of ac-tivities. The study identified the following causes: walking around the position, leaving the position and waiting. The reasons for leaving the position and excessive movement have been analyzed to find out that the majority of problem comes from lack of order in covering jigs handling. Employees are looking for covering jigs in their work areas and elsewhere. In addition, due to the lack of instruction manu-als, employees tend to talk to each other to make sure that proper covering jigs are used to mask specific items. A simple solution is to introduce appropriate layout and order in the work area as well as standards for masking items with covering jigs. Excessive transport can be solved by selecting one person to feed items to the paint shop in the correct sequence (Milk Run).
In the area of painting muda accounted for 35% of total activity. Including 13.19% due to waiting for the moving item and 12.28% due to leaving the position during automatic spay of primer. Waiting muda is directly connected with slow speed of the paint line and the downtime related to the large number of changeovers of the painting chamber due to colour change. Reducing the number of colour chang-es and complete elimination of line stops during changeovers would significantly re-duce the occurrence of the waste. The most favourable solution would be to increase the speed of the painting line while spraying primer as well as the topcoat. Emp-ty beams that occur between the items painted in different colours in auto mode can be filled with items painted with the use of a portable paint spray gun.
4. CONCLUSION
In the world of ruthless competition these days, companies that wish to remain leaders in their industries, should keep on asking the question: "How can we work better tomorrow than we are working today" (Imai, 2006, p. 15). The answer to this question rests in the common sense simple and low-cost methods such as the elim-ination of waste (muda). Identifying, minimizing and eliminating muda often re-quires no additional spending nor major investments in new technologies. Most often just a small changes in the workplace (a layout change), the introduction of order (5S standards) and standardization of work with the use of work instruc-tions and control charts can completely alter the process. Any organization that would like to direct employees attention to the process of continuous improvement, look for simple and low-cost ways to improve economic performance and to build a stable position in the competitive market place can benefit from the Kaizen prac-tices. The cases described in this article are proof of the above.
Unfortunately still many companies today do not use the opportunities offered by the Kaizen philosophy, its methods and tools. Some companies tend to ignore low-cost solutions and reach for very expensive management tools which frequent-ly do not fit their specific needs and capabilities. Others do not understand that the methods comprising kaizen are not just the latest fad. They will bring results only if understood as a continuous improvement approach to work, which should take root in the company on a permanent basis.
ACKNOWLEDGEMENTS
The authors of the article would like to thank the staff of companies X, Y, for the information provided.
REFERENCES
Imai M., (2006), „Gemba Kaizen Zdroworozsądkowe, niskokosztowe podejście do zarządzania”, MT Biznes Sp z o.o., Warszawa.
Liker J. K. & Meier D. P., (2011) „Droga Toyoty. Praktyczny przewodnik wdrażania 4P Toyoty”, MT Biznes, Warszawa.
Rother M. & Shook J., (2009), „Naucz się widzieć: eliminacja marnotrawstwa poprzez mapowanie strumienia wartości”, Lean Enterprise Institute Polska, Wrocław. Womack J. P. & Jones D. T., (2001), „Odchudzanie firm. Eliminacja marnotrawstwa –
kluczem do sukcesu”, Centrum Informacji Menedżera, Warszawa.
Womack J. P. & Jones D. T., (2003), „Lean thinking. Banish waste and create wealth in your corporation”, Simon & Schuster, New York.
BIOGRAPHICAL NOTES
Barbara Chomątowska, Agnieszka Żarczyńska-Dobiesz are academic tutors
in the Department of Production and Work Management at the University of Economics in Wroclaw, they conduct classes in: production and operation management, motivation, human resources management, they conduct research in the area of production and operation management, human resources, management of occupational health and safety, they are authors and co-authors of numerous publications in academic science journals, chapters in scientific monographs.