TRENDS
in
Sport Sciences
2016; 3(23): 129-139 ISSN 2299-9590What is already known on this topic?
The increasingly high performance among athletes today causes that coaches have to meet more and more complex and more comprehensive requirements. Facing these challenges calls for looking for solutions aimed at reasonable and effective preparation of athletes. Striving for achievement of a champion level has led to shifting the emphasis in coaching onto the period of youth and childhood.
Received: 26 June 2016 Accepted: 17 August 2016
Corresponding author: karpowicz@awf.poznan.pl
1Poznan University of Physical Education, Department of the Theory of Sport, Poznań, Poland
2Poznan University of Physical Education, Department of Team Sports Games, Poznań, Poland
KRZYSZTOF KARPOWICZ1, JAROSŁAW JANOWSKI1, MAŁGORZATA KARPOWICZ2
RYSZARD STRZELCZYK1
Trends of changes in structure of physical fitness among
young athletes
Abstract
Introduction. Training of children and young people is one of the most important stages and subsystems in coaching and determines future achievements of adult athletes. Level of physical fitness determines effectiveness of coaching and development of technical skills, influences the effectiveness of tactical actions and has an impact on current psychical disposition of a person. Aim of Study.
The research presented herein focused on establishing trends in the changes of young fencers’ motor effects (their structure and level) in the period of 2006-2013 with reference to tasks aimed to comprehensively shape functional, fitness and technical foundations that take account of requirements set by a desired specialisation and regarded as typical for an oriented stage of sport training.
Material and Methods. The study was based on the findings of
research carried out 2006-2013 among young fencers – members of the Junior Team of the Greater Poland region (KWJ). The analysis involved a total of 200 boys aged 15 to 16. Measurements – designed to determine the level and structure of the fencers’ motor effects – were conducted by means of the International Physical Fitness Test. The test was also to assess basic somatic parameters, such as body height and weight, and to calculate the BMI. Results. The research found out that the general physical fitness of young fencers established on the basis of the International Physical Fitness Test – decreases in subsequent age groups. It may be a consequence of a regressive trend in intergenerational motor changes generally observed in the population, or relate to a change in height-and-weight proportions leading to an increase in body corpulence. Conclusions. A significant drop in strength related to
overcoming one’s body resistance is most likely an outcome of the above-mentioned changes in the body structure. Therefore, as it appears, this fact should not be regarded as confirming a view that the so-called strong types of physical fitness are now more seldom among young people. A rise in endurance abilities in the period under research is a positive phenomenon from the point of view of fencing requirements, but also or even mainly – in the context of reversing the negative trend as regards lower general fitness of the young generation.
KEYWORDS: young athletes, training stages, motor preparation.
Introduction
I
t is essential for top performance in any sport that an athlete has a particular level of comprehensive physical fitness. Consequently, this is reflected by the division of training process into individual stages of comprehensive, sport-oriented and sport-specific training. The goal of the stage of sport-oriented preparation is to develop motor potential and equip a person in rich resources of motor skills oriented at sport-specific training in the future [1]. Constant verificationof training effects helps coaches choose individual contents and load in programs for each athlete.
Training of children and young people is one of the most important stages and subsystems in coaching and determines future achievements of adult athletes [2]. Level of physical fitness determines effectiveness of coaching and development of technical skills, influences the effectiveness of tactical actions and has an impact on current psychical disposition of a person [3, 4]. Physical fitness profile is dynamically developed over the entire period of growth. Therefore, it is largely determined by a dynamic functions rather than static components of motor skills. From this standpoint, training in the period of intensive individual growth should be oriented at comprehensive improvement of the functions and transforming them into sport-specific physical fitness as the dynamics of natural body transformations slows down [1, 5-10].
Although undoubtedly true, the above postulates have been often neglected in sport practice. Furthermore, although coaches realize the importance of sport in stimulation of young athlete’s development, they often go too far in intensification of load in particular directions in order to achieve the temporary effects. Thus, the process of sport training requires constant monitoring while the achievements might be one of the criteria for measuring progress [2].
In light of the above, the aim of the present study was to identify the tendencies for changes in the structure and levels of motor effects among young fencers in 2006-2013 in the context of comprehensive development of functional, fitness-related and technical bases with respect to the requirements of specific training adapted as typical of oriented stages in coaching [11, 12]. Material and Methods
Subjects
The study evaluated sport-talented young people from the Greater Poland region who were members of the System of Youth Sports within the framework of the Voivodship Junior Teams. The research material was collected from a survey that encompassed a 8-year time period (2006-2013). Two hundred forty five young fencers participated in the survey. However, analyses included only the people with all the necessary test results. The number of cases analysed was 200 boys aged 15-16 years (mean ± SD: age = 15.5 ± 0.5 years). The survey was carried out as part of cooperation between Eugeniusz Piasecki Poznan University of Physical Education and the Greater Poland Sport
Association. The measurements were made every year (Table 1) and the dates were due to a temporal structure of training for young people in fencing.
Table 1. Number of participants over the course of the study
Year of study Boys (n)
2006 25 2007 25 2008 24 2009 26 2010 25 2011 25 2012 25 2013 25 Total 200
The young fencers who were a group of select players with best performance in the Greater Poland region under the junior younger category were exposed to training load and competition load which is typical of this stage of training. The weekly training volume in the clubs ranged from 8 to 10 hours on average, with the number of battles played in the season ranged from 75 to 130 (depending on the sports level of the player). The players included in the study took part in the training for the Voivodship Junior Teams, focused on improvement in technical and tactical skills, were preparing to the finals of the National Youth Olympic Games.
The research presented in this paper was conducted in accordance with the ethical standards of the Declaration of Helsinki (Ethical Principles for Research Involving Human Subjects). Participants and their parents and guardians were informed of the testing procedures and have given their written informed consent. The study was approved by the local Research Ethics Committee (Karol Marcinkowski Poznan University of Medical Sciences, Poland, resolution numbers 712/05 and 519/07).
Procedures
The measurements focused on the level and structure of motor effects in the athletes studied. For this purpose, we used the International Physical Fitness Test (IPFT) [13] battery which included eight simple tests which were complementary enough to allow for a comprehensive evaluation of physical fitness. With its over 40-year
history, IPFT has been widely used by numerous coaches and researchers who use this non-complex method to evaluate the effective aspect of human motor activity [14]. IPFT battery is also recommended by the Ministry of Sport and Tourism in Poland as a tool for evaluation of physical fitness of young talented athletes. Measurements of motor skills and flexibility were carried out according to the recommendations for the International Physical Fitness Test battery [13, 15]. Speed was evaluated by means of a 50-meter sprint test, also termed a short run (it evaluates locomotor speed); endurance of the girls studied was evaluated over a distance of 1000 metres (running endurance); flexibility: a 4 × 10 meter shuttle run with moving the block. Strength was tested with a standing long jump test (explosive power of lower limbs) and 30-second sit-ups (strength endurance of trunk muscles). Handgrip strength was tested by means of handgrip dynamometer, whereas the upper limb strength and shoulder girdle strength was evaluated using a pull-up test on a bar. Trunk flexibility is an anatomical trait of a person, with standing trunk flexion test used to reveal the scope of vertebral column and hip joint movement. The results obtained in individual parts of the International Physical Fitness Test were converted into the scale of 0 to 100 points (calculated according to the T scale) depending on the chronological age of the subjects, which represents the main criterion in selection for training groups in children and youth sport at individual stages of coaching (Table 2).
We also measured basic somatic parameters such as body height and weight and calculated BMI (Body Mass Index).
Table 2. Standards for classification of physical fitness in
IPFT [16]
Physical fitness level (regardless of age or sex)Score range in points
High 481 and above
Average 320–480
Low 319 and below
Statistical analyses
We used basic statistical methods for the analysis of the results. The following pieces of software were employed: Statistica 10 PL, Microsoft Office 2010. The statistics calculated included arithmetic mean, standard deviation, minimum and maximum. The results were normalized with respect to the mean and standard deviations. The significance of differences between mean results in individual years was evaluated using Tukey’s honest significant difference (HSD) test [17]. Results
Statistical characteristics observed results are presented in Table 3.
Table 3. Statistical characteristics of test results of male fencers in consecutive years
Y ear Body height Body mass BMI 50-m run Long jump 1000-m run Handgrip strength Pull-ups 4×10-m run Sit-ups Standing forward bend IPFT score (cm) (kg) (kg/m2) (points) (points) (points) (points) (points) (points) (points) (points) (points)
2006 N 25 Average 174.3 63.2 20.7 59.4 57.2 52.8 62.1 43.7 61.0 59.7 54.8 450.6 Minimum 159.6 39.5 14.9 44.0 42.0 37.0 35.0 10.0 48.0 49.0 34.0 358.0 Maximum 186.5 79.0 26.5 76.0 84.0 62.0 99.0 65.0 70.0 71.0 68.0 542.0 SD 7.25 10.39 2.74 9.82 11.37 7.06 20.85 11.03 5.71 6.07 9.34 53.43 2007 N 25 Average 169.5 55.3 19.1 56.1 54.1 51.1 50.2 42.0 60.5 54.4 53.6 421.9 Minimum 155.0 39.0 15.0 36.0 35.0 39.0 28.0 10.0 41.0 36.0 33.0 294.0 Maximum 190.0 79.6 22.7 78.0 74.0 64.0 73.0 75.0 73.0 68.0 73.0 516.0 SD 8.88 10.13 1.97 8.23 9.95 7.12 12.61 18.87 7.78 8.41 10.14 59.44
2008 N 25 Average 171.6 59.3 20.1 56.3 53.9 55.0 47.5 45.2 60.1 58.3 56.0 432.3 Minimum 152.3 42.4 16.0 29.0 34.0 40.0 33.0 10.0 47.0 45.0 38.0 324.0 Maximum 184.2 80.0 27.1 64.0 69.0 63.0 63.0 65.0 68.0 76.0 78.0 501.0 SD 8.00 7.77 2.45 7.44 8.30 6.48 8.01 14.58 5.32 8.57 10.01 40.07 2009 N 25 Average 174.3 63.4 20.8 58.0 51.9 54.0 47.7 35.2 60.3 60.3 56.3 423.5 Minimum 159.8 49.1 17.9 40.0 31.0 37.0 31.0 10.0 48.0 49.0 29.0 299.0 Maximum 185.4 81.2 25.2 68.0 65.0 65.0 65.0 56.0 68.0 73.0 77.0 510.0 SD 7.42 9.03 1.94 6.72 8.86 7.01 8.93 17.37 6.36 6.67 10.98 53.36 2010 N 25 Average 174.0 63.0 20.8 57.2 50.3 53.1 49.8 38.7 58.8 56.4 52.0 416.3 Minimum 165.0 51.0 15.9 31.0 30.0 26.0 35.0 10.0 39.0 20.0 30.0 284.0 Maximum 189.0 81.0 26.2 74.0 99.0 67.0 77.0 56.0 73.0 75.0 74.0 561.0 SD 5.30 7.54 2.31 7.48 12.54 8.44 10.03 15.04 6.88 11.47 9.48 53.94 201 1 N 25 Average 176.0 62.0 20.0 56.0 57.9 55.2 50.8 46.4 65.8 56.0 54.6 442.7 Minimum 157.0 43.8 16.3 33.0 42.0 43.0 38.0 10.0 55.0 43.0 34.0 380.0 Maximum 191.0 76.3 25.8 64.0 68.0 66.0 69.0 59.0 72.0 73.0 72.0 502.0 SD 6.96 8.01 2.10 7.15 6.88 5.67 8.36 10.58 4.21 8.19 10.41 35.49 2012 N 25 Average 175.9 63.5 20.5 56.7 54.9 49.0 49.2 42.6 62.8 58.1 53.0 426.2 Minimum 161.0 48.2 16.7 43.0 40.0 37.0 38.0 10.0 54.0 47.0 34.0 336.0 Maximum 184.0 96.3 30.4 72.0 73.0 63.0 63.0 62.0 69.0 68.0 72.0 489.0 SD 5.77 9.69 2.60 6.72 8.61 7.44 7.28 15.54 4.29 4.78 9.65 40.99 2013 N 25 Average 174.2 58.9 19.3 52.0 55.9 47.2 48.3 38.2 61.6 54.2 55.2 412.6 Minimum 160.0 43.6 15.8 36.0 40.0 26.0 34.0 0.0 47.0 38.0 38.0 320.0 Maximum 187.0 71.3 23.3 63.0 67.0 57.0 69.0 65.0 70.0 64.0 73.0 477.0 SD 6.98 8.57 2.04 7.46 7.56 9.13 8.97 22.25 5.59 6.66 10.05 44.19
Analysis of differences between mean results obtained in 2006 and 2013
The first step was to analyse the significance of differences between mean results. This was achieved
using the Tukey’s honest significant difference [HSD] test. The results of the calculations are presented in Table 4.
Table 4. Significance of differences between mean results obtained by subjects in consecutive years (Tukeys honest significant difference test) Body height Body mass BMI 50-m run Long jump 1000-m run Handgrip strength Pull -ups 4×10-m run Sit-ups Standing forward bend IPFT score (cm) (kg) (kg/m2) (points) (points) (points) (points) (points) (points) (points) (points) (points) pts. Average 2006 174.3 63.2 20.7 59.4 57.2 52.8 62.1 43.7 61.0 59.7 54.8 450.6 Average 2007 169.5 55.3 19.1 56.1 54.1 51.1 50.2 42.0 60.5 54.4 53.6 421.9 Difference –4.8 –7.9 –1.6 –3.3 –3.1 –1.7 –11.9 –1.7 –0.5 –5.4 –1.4 28.7 Significance 0.3680 0.0827 0.3190 0.8449 0.9686 0.9945 0.1150 0.9999 0.9999 0.3925 0.9999 0.5349 Average 2007 169.5 55.3 19.1 56.1 54.1 51.1 50.2 42.0 60.5 54.4 53.6 421.9 Average 2008 171.6 59.3 20.1 56.3 53.9 55.0 47.5 45.2 60.1 58.3 56.0 432.3 Difference 2.1 4.0 1.0 0.2 –0.2 3.9 –2.7 3.2 –0.4 3.9 2.4 10.4 Significance 0.9647 0.7651 0.7555 1.0000 1.000 0.5468 0.9884 0.9964 0.9999 0.6440 0.9896 0.9947 Average 2008 171.6 59.3 20.1 56.3 53.9 55.0 47.5 45.2 60.1 58.3 56.0 432.3 Average 2009 174.3 63.4 20.8 58.0 51.9 54.0 47.7 35.2 60.3 60.3 56.3 423.5 Difference 2.7 4.1 0.7 1.7 –2.0 -1.0 0.2 –5.0 0.2 2.0 0.3 –8.8 Significance 0.9103 0.7011 0.9822 0.9957 0.9965 0.9998 1.0000 0.4023 1.0000 0.9919 1.0000 0.9987 Average 2009 174.3 63.4 20.8 58.0 51.9 54.0 47.7 35.2 60.3 60.3 56.3 423.5 Average 2010 174.0 63.0 20.8 57.2 50.3 53.1 49.8 38.7 58.8 56.4 52.0 416.3 Difference –0.3 –0.4 0.0 –0.8 –1.6 –0.9 2.1 3.5 –1.5 –3.9 –4.3 –6.8 Significance 1.0000 1.0000 1.0000 0.9999 0.9994 0.9998 0.9981 0.9956 0.9920 0.7201 0.8380 0.9997 Average 2010 174.0 63.0 20.8 57.2 50.3 53.1 49.8 38.7 58.8 56.4 52.0 416.3 Average 2011 176.0 62.0 20.0 56.0 57.9 55.2 50.8 46.4 65.8 56.0 54.6 442.7 Difference 2.0 –1.0 –0.8 –1.2 7.6 2.1 1.0 7.8 7.0 –0.4 2.6 26.4 Significance 0.9830 0.9999 0.9270 0.9996 0.1232 0.9772 0.9999 0.7268 0.0016 1.0000 0.9856 0.5753 Average 2011 176.0 62.0 20.0 56.0 57.9 55.2 50.8 46.4 65.8 56.0 54.6 442.7 Average 2012 175.9 63.5 20.5 56.7 54.9 49.0 49.2 42.6 62.8 58.1 53.0 426.2 Difference –0.1 1.5 0.5 0.7 –3.0 –6.2 –1.6 –3.8 –3.0 2.1 –1.6 –16.5 Significance 1.0000 0.9991 0.9961 0.9999 0.9634 0.0780 0.9996 0.9930 0.6704 0.9876 0.9992 0.9406 Average 2012 175.9 63.5 20.5 56.7 54.9 49.0 49.2 42.6 62.8 58.1 53.0 426.2 Average 2013 174.2 58.9 19.3 52.0 55.9 47.2 48.3 38.2 61.6 54.2 55.2 412.6 Difference –1.7 –5.4 –1.2 0.3 1.0 –1.8 –0.9 –3.6 –1.2 –3.9 2.2 –13.6 Significance 0.9950 0.6901 0.7255 0.4885 0.9999 0.9937 0.9999 0.9855 0.9983 0.7562 0.9965 0.9847 * denotes significant differences at p ≤ 0.05
Analysis of the significance of differences between mean results obtained in consecutive years shows that statistically significant differences occurred between the years 2006 and 2007 (in handgrip strength) and between 2010 and 2011 and concerned the level of agility. No statistically significant differences in somatic build variables were found between the teams studied in individual years of the study.
Analysis of differences in fitness tests revealed lower level of overall fitness, expressed by the total of points scored in IPFT by the young athletes tested in 2013. However, the difference was not statistically significant. It is remarkable that the girls obtained lower results in 6 of 8 tests compared to the members of the Voivodship Junior Teams in 2006.
Analysis of trends of changes in mean results obtained in 2006-2013
Assuming that changes in the results that occur over the time period studied might exhibit a uniform pattern (which was reflected by the differences between individual years, see Table 2), the next stage of the study was to attempt to identify certain trends in the level of the parameters studied.
Using the least squares method, we matched a polynomial model of the first or second order to the pattern of changes that occurred. The results of the analyses are illustrated in the respective diagrams (Figures 1-12).
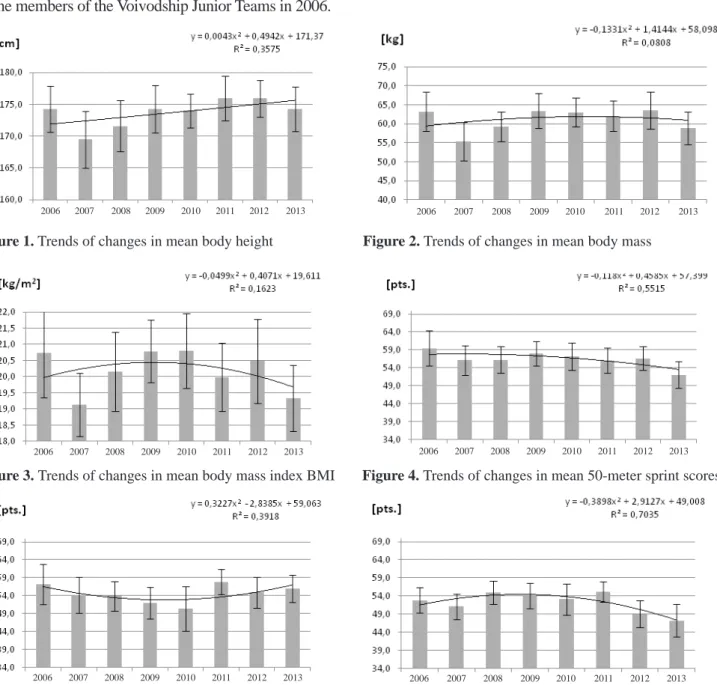
Figure 1. Trends of changes in mean body height Figure 2. Trends of changes in mean body mass
Figure 3. Trends of changes in mean body mass index BMI Figure 4. Trends of changes in mean 50-meter sprint scores
Figure 5. Trends of changes in mean long jump scores Figure 6. Trends of changes in mean 1000-meter run scores
2006 2007 2008 2009 2010 2011 2012 2013
2006 2007 2008 2009 2010 2011 2012 2013
2006 2007 2008 2009 2010 2011 2012 2013 2006 2007 2008 2009 2010 2011 2012 2013 2006 2007 2008 2009 2010 2011 2012 2013 2006 2007 2008 2009 2010 2011 2012 2013
Regarding morphological variables, a constant increase in body dimension in male fencers studied was observed. The height of the body shows a continuous upward trend (Figure 1).
Changes in body mass, however, showed different pattern, with a significant increase in the beginning of the period of the study and then the increase being not as sharp as before (Figure 2).
Consequently, the above variations in body height and mass affected BMI, with its value providing information
about weight-height ratio, thus being the indicator of a slimmer (lower values) or more obese (higher values) body build (Figure 3).
In running speed test, the highest mean value of the results was obtained in 2006. In subsequent years, the level of this property initially stabilized, but the trend line indicates a steady decline. Consequently, in the last time trial run test score 50 m reaches the lowest level (Figure 4). A gradual decline was observed to 2010 in the results obtained from long jump test. In subsequent years,
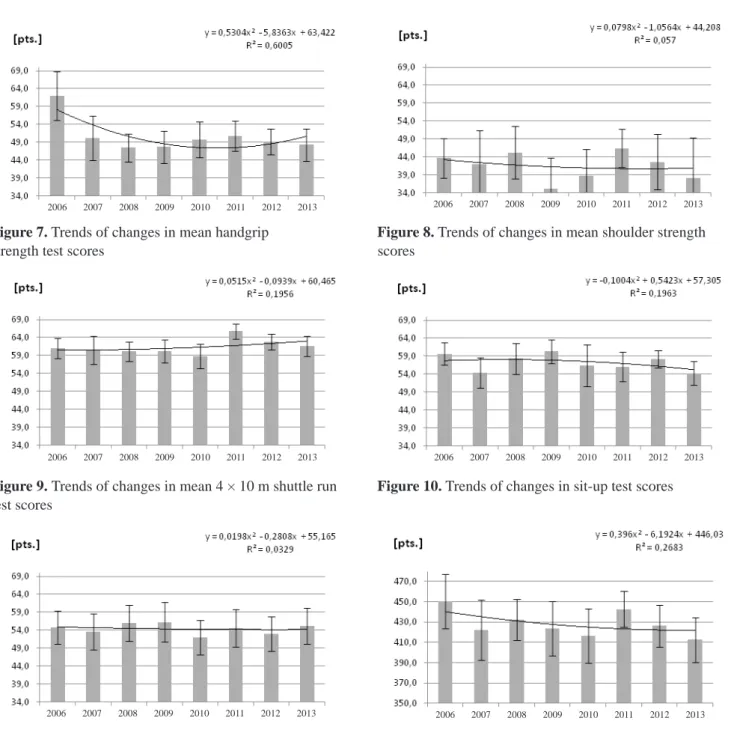
Figure 7. Trends of changes in mean handgrip Figure 8. Trends of changes in mean shoulder strength
strength test scores scores
Figure 9. Trends of changes in mean 4 × 10 m shuttle run Figure 10. Trends of changes in sit-up test scores
test scores
Figure 11. Trends of changes in trunk flexion test scores Figure 12. Trends of changes in total results obtained in IPFT
2006 2007 2008 2009 2010 2011 2012 2013
2006 2007 2008 2009 2010 2011 2012 2013
2006 2007 2008 2009 2010 2011 2012 2013 2006 2007 2008 2009 2010 2011 2012 2013 2006 2007 2008 2009 2010 2011 2012 2013 2006 2007 2008 2009 2010 2011 2012 2013
there was an upward trend. However, the power level of the leg strength studied fencers in 2006 and 2013 are comparable (Figure 5).
The average results obtained in the trial run at 1000 m tend to decrease the possibility of endurance tested fencers. After the initial increase, subsequent years showed a decrease of endurance (Figure 6).
The diagram that illustrates changes in the results obtained during handgrip dynamometer showed an initial decline in the level of this parameter. In the following year this value rose and maintained at the same level for two years and a renewed decline in the last two years (Figure 7).
The chart that illustrate changes in the results of shoulder strength reveal a decline in over the entire period of the study. While fencers surveyed in 2008 and 2011 obtained scores higher than their peers before, but again further research terms refer to a downward trend. Generally, the level of the characteristics of the respondents fencers over the next years is very low (Figure 8).
Changes in the results obtained in the shuttle run test were insignificant. An insignificant reduction in the level of flexibility was observed in the first half of the period of the study. The following test dates showed the results obtained by fencers similar to those obtained in the beginning of the study (Figure 9).
The results of the sit-up test showed a steady decline. Consequently, the young fencers examined in 2013 were characterized by a considerably lower level of abdominal muscle strength compared to their peers years ago (Figure 10).
In an attempt to flexibility was noted a slight tendency to reduce this parameter between the first and last date of study. In subsequent years, the average results of the trunk flexion fluctuate (Figure 11).
The last chart illustrates the total results for all the tests included in the International Physical Fitness Test battery. Despite certain variations in the level of overall fitness, the entire period of the study exhibits a declining tendency. It is worth noting that in the classification of physical fitness proposed by the Drabik [5] the studied fencers showed an average level (Figure 12).
Discussion
The stage of oriented training in sport is a specific period in human development, which coincides with high sensitivity of human body to external stimuli. It is impossible to develop young people’s aptitudes through training based on the methods used in adult population and consequently to neglect the postulate of comprehensiveness that promotes long-term
sport-specific development, as it exceeds the adaptive capabilities of young athletes. From the biological standpoint, the training load used should reflect the developmental age. It should be stressed that, if the training load is not based on the principle of individualization (with the main postulate being selection of the load appropriately to the athlete’s capabilities), it ceases to have a positive effect. Furthermore, if continued over a longer period of time, the inadequate training load might cause developmental disturbances and become a traumatological factor to cause overtraining and fatigue. Therefore, excessive training load with sport-specific exercises started at young age is illegitimate. Although using such stimuli leads to quick getting used to them, the adaptive mechanisms present in the growing human body are substantially depleted. Consequently, some talented athletes depart from sport prematurely, due to numerous injuries [7, 9, 19].
Regarding the physical fitness of athletes from the standpoint of long-term observation, the tendencies typical of general population should not be neglected. The phenomenon of temporal variability of motor development caused by environmental factors has been thoroughly researched. Therefore, one of the directions of the research studies on physical fitness is analysis of changes in motor development that occur between generations. Multiple studies have demonstrated a negative trend with increasing regression [20, 21, 22, 23, 24, 25]. The interpretation for these changes can be also found in the categories of development of a new fitness profile as a consequence of technological advances and, consequently, changes in lifestyles. The latter involves new systems adopted by young people, including the preferred model and dimension of motor activity.
The results of population studies can provide background for the observation of specific groups in different sports, such as fencing. Borysiuk [26] on the basis of the literature (including studies by Czajkowski and Brola) stated that the role of the overall efficiency decreases in subsequent stages of training. The largest of its importance falls on the initial step, which seems obvious. The author claims that the sports results in fencing depends mostly on technical and tactical skills, mental preparation on the basis of the efficiency-oriented. Considered particularly important psychomotor skills and practical application in fencing training exercises discussed forming ability, combined with manifestations of speed and improving mental processes.
Analysis of the results obtained by young fencers in consecutive years demonstrated that physical fitness
evaluated by means of the International Physical Fitness Test battery on consecutive years is decreasing. These findings confirm the above mentioned regressive trend of intergenerational changes. It seems logical, especially because the group studied was selected from the population, that the changes should reflect the changes which are typical of the general population. However, one could expect that subjects belonging to the group of increased physical activity will gain high results in the physical fitness test.
The causes of these phenomena might lie in changes in weight-height proportions that consisted in increasing body stoutness, which was the most noticeable in the studies conducted in 2009 and 2010. With regard to population studies, is reflected an analogy to the trend of increasing body mass in children and young people observed in recent years, which involves overweight and obesity, might be observed [20, 21, 27].
The findings of the present study may partially support the view proposed by Przewęda [28], concerning the structure of physical fitness of young Polish population. This researcher argued that, if the trends of changes continue, the speed- and flexibility-oriented types will be favoured over those strength-based. With regard to the young male fencers studied, this theory has reference mainly to the agility. In the shuttle-run test contestants received the highest scores of all the tests and the results were arranged at around 60.0 points. In two anaerobic trials: 50 m run and standing long jump results formed a range of about 59.0-54.0 points, and thus at a relatively low level, but higher than the results of other trials. Such laying of the results confirms Borysiuk [29], who indicates a predisposition to the anaerobic efforts of fencers among the five characteristics that affect the performance in fencing.
Physical capacity in young people represents an essential problem as one of the components of physical fitness. Changes in the course of development which have been observed over recent years showed a progressively negative trend [11, 23].
Some premises might suggest a confirmation in this unfavourable trend in the groups of young athletes studied. Over the period of eight years, insignificant decrease in stamina were observed despite the reduced levels recorded in the penultimate date of examinations. Obviously, this is a disadvantage from the standpoint of the demands of fencing as a sport of combined endurance and speed nature. Many authors point to the high values of VO2max at the top fencers at approximately 50.0 ml/kg/min in women and about 55.0-60.0 ml/kg/min in men [30, 31, 32]. Borysiuk [29]
confirms the high ceiling of the oxygen in the Polish top young athletes from Silesia region. The author concludes that the fencers presented a similar level of capacity like athletes in other endurance disciplines, however it is the result of specialized training fencing, control fights and tournaments. In this case capacity is not an object of separate training, but only the “side effect” of specialist training, which may provide poor performance in endurance running. The authors cited above point to the need to include in fencing training an aerobic and anaerobic load.
Although dissimilar in its nature, another important issue is the level of flexibility recorded in the groups studied. In many sports, including fencing, the development and maintaining the level of this skill is often neglected and coaches seem to forget that it has a substantial effect on the effectiveness of movements and also helps prevent injuries.
The most of time of the training process in various sports is spent on improvement of technique and tactics. Development of motor skills is often achieved as a by-product of specific training. But general physical fitness represents a solid foundation for development of technique and tactics, thus making it necessary to train motor skills (abilities) separately [33].
Conclusions
The overall physical fitness of young male fencers who participated in the study, evaluated using the International Physical Fitness Test, was found to be declining year by year. On the one hand, this might have been caused by the tendencies for regression in motor modifications across generations that have been observed among populations.
The essential decline we observed in strength (connected with overcoming the athlete’s own body resistance) is likely to be due to the above changes in body build. Therefore, it seems that it cannot be used as evidence to confirm the current views of decreasing percentage of strength-based types in the structure of physical fitness of young people.
What this study adds?
A substantial decrease in endurance in the period studied can be viewed as a negative trend from the standpoint of fencing requirements (pointing to some neglect training) and also in the broader context of reversing the negative tendencies among younger generations to show reduced physical fitness.
References
1. Sozański H, ed. Podstawy teorii treningu sportowego. RCM-SKFiS, Warszawa 1999.
2. Ważny Z. Współczesny system szkolenia w sporcie wyczynowym. SiT, Warszawa 1981.
3. Fraser-Thomas JL, Cote J, Deakin J. Youth sport programs: avenue to foster positive youth development. Phys Educ Sport Ped. 2005; 10(1): 19-40, doi: 10.1080/1740898042000334890.
4. Sozański H, Śledziewski D, Kielak D, Sukniewicz M, Perkowski K, Siwko F. Teoretyczne podstawy kształtowania sprawności fizycznej w procesie szkolenia sportowego dzieci i młodzieży. AWF, Warszawa 1985.
5. Karpowicz K, Strzelczyk R. Struktura poziomu efektów motorycznych młodych sportowców na etapie szkolenia ukierunkowanego. In: Strzelczyk R, Karpowicz K, eds., Etapizacja procesu szkolenia sportowego. Teoria i rzeczywistość. Monografie 407. AWF, Poznań 2012; 79-92. 6. Kosendiak J. Cele i założenia treningu na etapie wstępnym,
a jego realizacja. In: Strzelczyk R, Karpowicz K, eds., Etapizacja procesu szkolenia sportowego. Teoria i rzeczywistość. Monografie 407. AWF, Poznań 2012; 53-68.
7. Raczek J. Model treningu sportowego dzieci i młodzieży – poglądy, kontrowersje, propozycje. Sport Wyczynowy, 1984; 5: 37-55.
8. Raczek J. Podstawy szkolenia sportowego dzieci i mło- dzieży. RCM-SKFiS, Warszawa 1991.
9. Sozański H. Zróżnicowanie rozwoju sportowego młodocianych zawodników w zależności od rodzaju treningu. AWF, Warszawa 1986.
10. Sozański H, Adamczak J, Siewierski M. Etapizacja procesu szkolenia sportowego – teoria i rzeczywistość. In: Strzelczyk R, Karpowicz K, eds., Etapizacja procesu szkolenia sportowego. Teoria i rzeczywistość. Monografie 407. AWF, Poznań 2012; 8-39.
11. Karpowicz K, Karpowicz M, Strzelczyk R. Structure of physical fitness among young female basketball players (trends of changes in 2006-2013). J Strength Cond Res. 2015; 29(10): 2745-2757.
12. Strzelczyk R, Karpowicz K. Kilka uwag o etapizacji procesu szkolenia sportowego. In: Strzelczyk R, Karpowicz K, eds., Etapizacja procesu szkolenia sportowego. Teoria i rzeczywistość. Monografie 407. AWF, Poznań 2012; 3-8.
13. Rosandich TP. International physical fitness test. Sport J. 1999; 2.
14. Szopa J, Mleczko E, Żak S. Podstawy antropomotoryki. PWN, Warszawa 2000.
15. Pilicz S, Charzewski J, eds. Punktacja sprawności fizycznej młodzieży polskiej wg Międzynarodowego
Testu Sprawności Fizycznej. Kryteria pomiaru wydolności organizmu testem Coopera. AWF, Warszawa 2004. 16. Drabik J. Aktywność, sprawność i wydolność fizyczna,
jako mierniki zdrowia człowieka. AWF, Gdańsk 1997. 17. Stanisz A. Przystępny kurs statystyki z zastosowaniem
STATISTICA PL na przykładzie medycyny. Vol. I, II, III. StatSoft Polska, Kraków 2006.
18. Hirtz P, Starosta W. Sensitive and critical periods of motor coordination development and its relation to motor learning. J Hum Kinetics. 2002; 7: 19-28.
19. Naglak Z. Struktura czasowa szkolenia zawodników specjalizujących się w zespołowych grach sportowych. In: Ryguła I, ed., Czynniki warunkujące efektywność walki sportowej w koszykówce. AWF, Katowice 1995; 19-36.
20. Dobosz J. Indywidualna ocena kondycji fizycznej w perspektywie zmian populacyjnych. In: Charzewska J, ed., Biospołeczne aspekty rozwoju współczesnej młodzieży polskiej w okresie dojrzewania. AWF, Warszawa 2007; 65-73.
21. Jarosz M, ed. Otyłość, żywienie, aktywność fizyczna, zdrowie Polaków. Instytut Żywności i Żywienia, Warszawa 2006.
22. Malina R, Bouchard C. Growth, maturation and physical activity. Human Kinetics, Champaign 1991.
23. Przewęda R, Dobosz J. Kondycja fizyczna polskiej młodzieży. Studia i Monografie 98, AWF, Warszawa 2007.
24. Raczek J. Rozwój – podstawowy cel i wyznacznik szkolenia sportowego dzieci i młodzieży (wybrane aspekty). Sport Wyczynowy. 2001; 9/10: 39-61.
25. Tatarczuk J, Asienkiewicz R. Tendencje przemian wybranych cech morfologicznych i zdolności motorycznych w okresie dwudziestolecia. In: Miecznikowski T, ed., Dodatnie i ujemne aspekty aktywności ruchowej. Uniwersytet Szczeciński. 2001; 2: 159-166.
26. Borysiuk Z. Psychomotoryczne i osobowościowe uwarunkowania poziomu mistrzowskiego w szermierce. Politechnika Opolska, Studia i Monografie 127, Opole 2002.
27. Karpowicz K, Karpowicz M. Reflections on the changes observed in the structure of motor skills in young athletes. Hum Mov. 2013; 14(3): 221-228.
28. Przewęda R. Stan rozwoju i sprawności fizycznej dzieci i młodzieży w Polsce. Opinia zlecona przez Biuro Studiów i Ekspertyz Kancelarii Sejmu. Warszawa 1999. 29. Borysiuk Z. Współczesna szermierka na szable.
Biblioteka Trenera, 2005.
30. Bottoms L. Physiological responses and energy expenditure to simulated epee fencing in elite female fencers. Serb J Sport Sci. 2011; 1: 17-20.
31. Koutedakis Y, Ridgeon A, Sharp NCC, Borehamt C. Seasonal variation of selected performance parameters in epee fencers. Br J Sp Med. 1993; 27(3).
32. Nystrom J, Lindvall O, Ceci R, Harmenberg J, Svedenhag J, Ekblom B. Physiological and morphological characteristics
of world class fencers. Inter J Sports Med. 1990; 11(2): 136-139.
33. Wachowski E, Strzelczyk R. Atuty cech motorycznych. Trening. 1991; 1: 106-114.