DETERMINING MAITENANCE SERVICES USING
PRODUCTION PERFORMANCE INDICATORS
Katarzyna Szwedzka* and Małgorzata Jasiulewicz-Kaczmarek**
* Faculty of Engineering Managment, Poznan University of Technology, Poznan, 60-965, Poland, Email: katarzyna.szwedzka@gmail.com
** Faculty of Engineering Managment, Poznan University of Technology, Poznan, 60-965, Poland, Email: malgorzata.jasiulewicz-kaczmarek@put.poznan.pl
Abstract. Increasing efficiency of machines and strong competition between companies, popularized
the use of measures for maintenance service, designed to increase efficiency and reduce the costs of the machines usage. These indicators, help to achieve the reliability of production centers, eliminating potential events associated with electric, hydraulic and pneumatic failures. The aim of the work was to investigate the dependence of performance indicators used by the maintenance services, with the number of parts produced on automated production lines. Then assessed the relationship between the productivity of the line and the ratio of effective production time and how much time is spent on resolving the failure. Interpretation of measurement helped to make the joint improvement activities in the publication described production plants.
Paper type: Research Paper Published online: 31 August 2016
Vol. 6, No. 4, pp. 361–374
DOI: 10.21008/j.2083-4950.2016.6.4.8
ISSN 2083-4942 (Print) ISSN 2083-4950 (Online)
© 2016 Poznan University of Technology. All rights reserved.
1. INTRODUCTION
The role of maintenance and financing their proper functioning are an indicator of a well-functioning production company. Based on statistical data and knowledge of operators, organization is looking for the possibility of determining the limit damage’s symptom, so as to obtain maximum efficiency in the use of machines (Bojar & Żółtowski, 2011). In terms of available methods, it is possible to use pat-tern recognition, analysis and correlation of events, statistical data analysis and monitoring of alarm thresholds, with the aim to achieve reliable production centres, eliminating future production problems associated with failures of electrical, hy-draulic and pneumatic systems (Żółtowski, 1996).
The aim of the paper was to investigate the dependence of performance indica-tors used by the maintenance services, and the number of parts produced on auto-mated production lines. The article analysis the average repair time and mean time between failures in two factories producing furniture. The collected data provide a description of the work of four double-end tenoner lines, with similar technical parameters and purpose of usage. Based on the obtained information, the line stops reasons assigned to three groups. The first concerns the operational efficiency in terms of technical and organizational – technical. The second group is focused on preventive measures carried out by the machine operators and maintenance service workers. The third group of downtime, categorized the activities dependent on the current methods of management organization and accepted standards for techno-logical processes (Loska, 2013).
The paper is organized as follows. The second chapter describes the theoretical aspect of the work. The third chapter describes the utilization rates of production equipment as well as their effectiveness in relation to initiated improvement activi-ties, based on the data used in the publication of two furniture production plants. The fourth section characterizes one of the four production lines and shows the relationship between the productivity of the line level with effective production time and the time that is devoted to the elimination of the fault. The fifth chapter describes interpreted indicators and improvement actions implemented jointly in the production plants. The sixth chapter is a summary and conclusions.
2. MEASURES OF OPERATION EFFECTIVENESS ASSESSMENT
Efficiency is understood as a property of the operation object (or system) condi-tioning the level of the tasks realisation of the object or system under certain operat-ing conditions and within a certain period of time. Operatoperat-ing efficiency can be de-fined as the quotient of the effects achieved in a given period of duration of a specific operation state of the object to the expenditures to achieve these effects (Antosz & Sadnicka, 2015). Inherent in assessing the effectiveness of the enterprise it, is to
build a system for measuring performance, so use a variety of measures and indica-tors, known collectively as KPI (Key Performance Indicator). These measures, are used to evaluate the key measures implemented in different functional areas of the company and indicate their effectiveness in relation to the objectives of the organi-zation. In the area of maintenance for enterprise indicators and metrics can be di-vided into the following categories (Loska, 2013):
• model of reliability,
• operation of object in terms of technical point of view (in the form of prob-abilities, related to certain classes of states (e.g. a function of reliability in terms of the exponential distribution, the intensity of the damage, the tech-nical readiness coefficient)),
• operation of objects in terms of organizational and technical points of view (measures received from both the identification of the technical condition, as well as the activities of organizational and economic services supplies, for example. MTBF, MTTR and MFOT),
• model of operational efficiency OEE (Overall Equipment Effectiveness), • organizational and technical model – KPI.
Their primary function is, among others (Adamkiewicz & Burnos, 2012), to show the current and historical values, performance characteristics and the rela-tionships between them, enabling the comparison of the values obtained from the design values and the values obtained from observations of other operating sys-tems, diagnostics implemented maintenance actions, the realization of continuous process improvement by finding and eliminating significant deviations from as-sumed value of the project, track changes and progress in the system of exploita-tion, motivating and settlement of technical and managerial staff with the achieved results, and so on.
3. PERFORMANCE INDICATORS USED BY THE MAINTENANCE
SERVICES IN DESCRIBED ENTERPRISES
The purpose of described companies is a joint production of pine box furniture, targeted at the general audience. Pine, due to the availability and its characteristics is a competitive product against the solid wood furniture of other species through the use of mass production. Modern technologies allow securing raw material staining wood surfaces so as to make the durability and quality, which greatly in-creases the usability of pine itself. Plants located next to each other have their own organizations, and depending on the number of orders and the adaptation of ma-chine parks, produce identical or different elements of requested goods.
3.1. Operational efficiency model OEE
One of the most commonly used measure in the described enterprises assessing the efficiency of the maintenance, production and logistics is measurement of pro-duction equipment efficiency – OEE (Szwedzka, Jasiulewicz- Kaczmarek & Szafer, 2015). Model of operational efficiency OEE is a key model of assessing the effec-tiveness of the use of production equipment used in the TPM strategy (Total Produc-tive Maintenance) (Nakajima et al., 1988), and for many manufacturing companies is a basic indicator of machines and devices efficiency. OEE describes three basic areas: availability, efficiency and quality of products (Loska, 2013).
The essence of OEE is based on comparing the use of the machine for perfect use, which occurs when production and its preparation are carried out according to plan, continuously and the maximum possible speed with the maximum expected quality. Calculation of OEE and its value is the starting point for all activities re-lated to the improvement of the value stream in terms of machinery and equipment, allowing measuring their effect after implementation.
In this article, the indicator will not be analysed and was used to indicate the ef-ficiency measures described in enterprises only.
3.2. Mean Time Between Failures (MTBF)
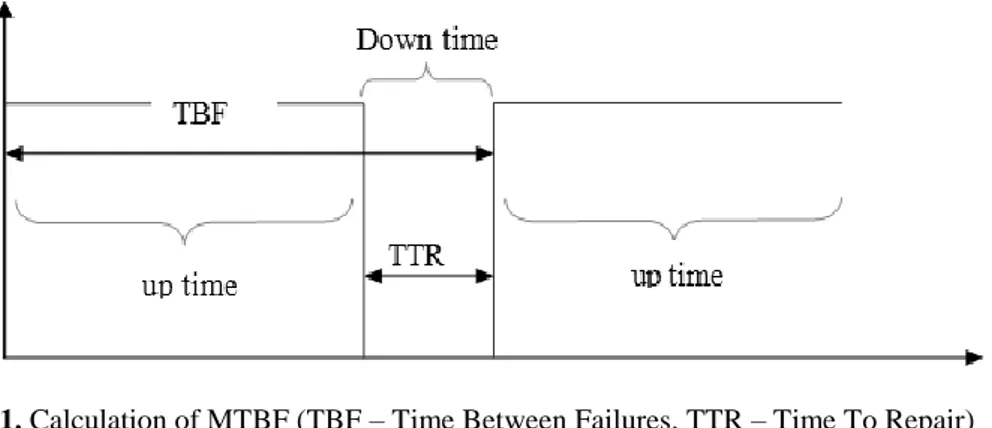
MTBF, is the most widely used indicator of reliability measurement and in-forms about the arithmetic mean of times between failures of the system. Determi-nation of MTBF assumes that the system is ready to work after failure and enabled for use immediately after removal of the fault (Pourjavad, Shirouyehzad & Shahin, 2011). An analysis method shown in equation 1 (Fig. 1).
3.3. Mean Time to Repair
MTTR is the most widely used measure of the effectiveness of maintenance. This indicator measures the average time that is required to perform corrective actions on all moving parts of the system (Equation 2, Fig. 1) (Pourjavad, Shirouyehzad & Shahin, 2011).
Indicator provides information about the time of repair and maintenance, in-cluding, inter alia take into account time needed: to properly diagnose the cause of the accident, for ordering and delivery of the components necessary to repair fail-ures, to restore the device operational status, for the replacement of damaged parts, time required to access the affected part, etc.
4. INTERPRETATION OF KEY PERFORMANCE INDICATORS
AND THEIR IMPACT ON THE PLANNING OF THE MACHINERY
OPERATION
4.1. Characteristic and evaluation of tested objects effectiveness
Double-end tenoner lines are used for formatting end edge processing of ele-ments. The machines are equipped with automatic feeders, double-end tenoners machine for along grains processing, turning unit, double-end tenoner for across grains processing, conveyor, two automatic arterial drilling machines, turning unit and stacker. Elements such as the feeder, stacker and duble-end tenoner are nu-merically controlled and change of setup is done by selection of appropriate pro-gram. Only the work of drilling machine requires operator intervention, i.e. ex-change of drilling chucks with drill spindles. Each of the tested line runs at 30-50m/min, in three shifts mode (Fig. 2). Each line is supervised by two operators, whose task, among others, is adjusting setups for new element processing and pre-ventive technical service of the line (Szwedzka, 2014).
Formatting lines are major production equipment for pine box furniture. Beside thickness calibration and lacquering treatment, lines perform all machining opera-tions on pine glue board elements. Their reliability has a key influence on the ef-fectiveness of all remaining stages of furniture production.
In order to determine the operational performance line are used ratios for deter-mining the production time of one particular element. Double-end tenoner lines setup time is determined on the basis of carrying out a series of measurements.
Since it is not always a constant value, the average setup time line is divided by the size of the batch and then added to the processing time of each piece at a work-station. Taking into account the quantities produced, processing times and time settings can be used, determines the need of line usage.
Fig. 2. Double-end tenoner line (formating line) for panels processing (in order: feeder,
double-end tenoner, turning unit, double-end tenoner, conveyor, drilling machines, con-veyor, stacker)
Efficiency of operated double-end tenoners can be categorized into three levels (Tab. 1). From the hardware level (technical one) machine performance technical barriers are being removed through a variety of investments for improvements or reparation. From the logistics (preventive level) continuity in the availability of materials by changing the organization of the flow of these materials and supervi-sion over efficiency of machines and transport is provided. From the planning (management level), seeks to eliminate activities not directly related to the produc-tion process.
Table 1. The average percentage of downtime share for 4 formatting lines Downtime
cathegory
Charcteristics Double-end tenoner line
Plant A Plant B
M1 M2 M3 M4
Technical level
failures directly affecting the efficiency of the equipment, ie .: electrical, pneumatic,
mechanical, IT, double-end tenoner segments, drilling machines, feeders and
stackers, technical – undefined
7.12% 8.43% 10.11% 6.12%
Preventive level
total downtime indirectly influencing the efficiency of the equipment, ie.: settings calibration, machine cleaning, preventive
maintenance
8.19% 20.97% 11.2% 16.34%
Management level
actions that could in the future be carried out without stopping the line by coordination of
actions with line operators, ie.: a lunch break, production meetings, lack of material
on the line
7.54% 5.95% 6.86% 6.36%
Information regarding lines downtime contained in Table 1 is the key informa-tion from the obtained data. Their categorizainforma-tion allows for the preliminary and the general interpretation by comparing similar characteristics or periods for operated lines. Further and detailed analysis of downtime is based on the KPIs used in the
enterprise. Measures depending on the machine type, its purpose or age are used to assess their performance and are a benchmark in undertaking maintenance and repairs actions or investments.
4.2. Measuring the efficiency of machines based on MTTR and MTBF
indicators
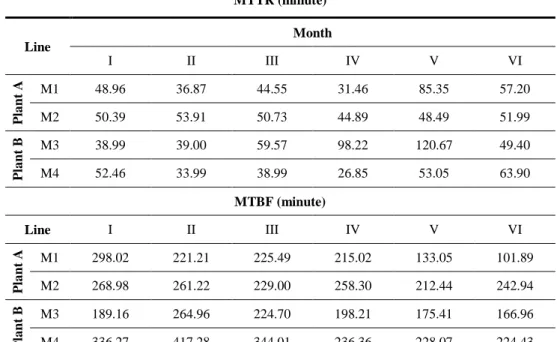
In the article contained two indicators based on which maintenance departments of company analyse operated lines. The measurement was carried out according to common assessment criteria, providing the same picture for the two companies. The MTTR indicator, counted on the basis of failures recognised on technical level, so those which are directly related to the state of the suitability of the system, by making a detailed analysis of its condition, and the MTBF indicator (Tab. 2). Table 2. Measures of effectiveness used in manufacturing plants
MTTR (minute) Line Month I II III IV V VI Pl a n t A M1 48.96 36.87 44.55 31.46 85.35 57.20 M2 50.39 53.91 50.73 44.89 48.49 51.99 Pl a n t B M3 38.99 39.00 59.57 98.22 120.67 49.40 M4 52.46 33.99 38.99 26.85 53.05 63.90 MTBF (minute) Line I II III IV V VI Pl a n t A M1 298.02 221.21 225.49 215.02 133.05 101.89 M2 268.98 261.22 229.00 258.30 212.44 242.94 Pl a n t B M3 189.16 264.96 224.70 198.21 175.41 166.96 M4 336.27 417.28 344.01 236.36 228.07 224.43
Summarizing the information contained in Table 2, lines 1 and 2 at the factory A is operated at a similar level as the line 3 and 4 of the plant B. Based on the type of manufactured product range can be inferred that the lines have similar technical problems. In order to search for a correlation between the received values of the indicators and produced assortment. Collected information on the monthly per-formance of linear meters for each line for a period of six months presents Tab. 3.
Table 3. Running meters of elements processed on double-end tenoner lines
Running meters for double-end tenoner lines (monthly)
Line Months I II III IV V VI Pl a n t A M1 306 685 314 344 294 101 335 687 23 166 242 061 M2 271 216 354 039 262 893 328 549 266 004 318 762 Pl a n t B M3 337 011 424 869 406 297 521 217 305 231 391 011 M4 255 007 351 313 294 465 293 765 242 259 306 672
To identify the relationship between the productivity of the line with respect to the effective production time and the time that is spent of the breakdown, used Pearson correlation coefficient (Tab. 4).
Table 4. Correlation coefficient of MTBF and MTTR between the number of items
pro-duced on the lines
Pearson coorelation Lines MTTR to curent meters MTBF to curent meters Plant A M1 -0.965 0.613 M2 0.193 0.534 Plant B M3 -0.009 0.395 M4 -0.407 0.519
The resulting ratios may, however, provide a lot of valuable information. They can be used as a primary tool to determine the ratio of each failure to total failures or for machines effectiveness planning with the theoretical assumption of line availability time. Modification of plan based on data MTBF can shorten line cali-bration time or increase the time required for maintenance of machines without additional machine stop times.
5. INTERPRETATION OF EFFICIENCY MEASURES IN
ENTERPRISES
Since the dependencies between variables have weak correlation, the compound of the general data between the calculated sums of the value of the index in relation to his individual characteristics can be analysed. In case of machines failures, data already collected can show the components of the machine that is the most critical and where to plan corrective actions or repair. High frequency of occurrence of
a failure in the sub-assembly can also indicate control points of produced element until failure removed or to take action to eliminate the source of occurrence.
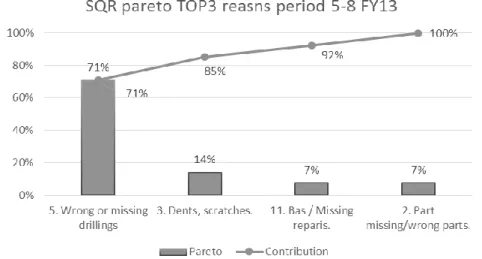
For further analysis, data regarding customer claims obtained from the sales de-partment were used (Fig. 3).
Fig. 3. Pareto analysis of the percentage share of defects of products returned by customers The cause of complaint was the impossibility of furniture assembling due to wrongly performed frilling operation. The main causes of product returns related to: offset of holes, shallow drilling, wrong diameter, collision of drillings, holes on wrong side. Drilling machines used in lines were analysed (Tabs. 5, 6, Fig. 5). Table 5. Downtimes for double-end tenoner lines and downtimes caused by drilling
ma-chine only
total technical downtime [min] downtime of drilling machine[min]
Line number Line number
M1 M2 M3 M4 M1 M2 M3 M4 2 203.15 1 965.24 2 105.43 1 469.00 1 645.96 1 345.20 1 125.47 568.00 2 027.71 1 940.93 1 326.03 985.63 1 836.49 8 65.68 956.32 452.00 1 648.38 2 282.90 2 561.36 1 247.80 1 243.26 1 298.00 1 504.00 752.36 1 446.98 1 256.88 4 714.40 2 389.47 1 345.00 729.13 2 540.23 1 001.63 4 011.36 1 309.30 6 757.30 2 440.10 2 899.12 769.29 4 201.74 958.58 3 775.45 3 119.50 2 667.85 3 642.47 1 140.85 2 068.00 1 542.00 1 938.25
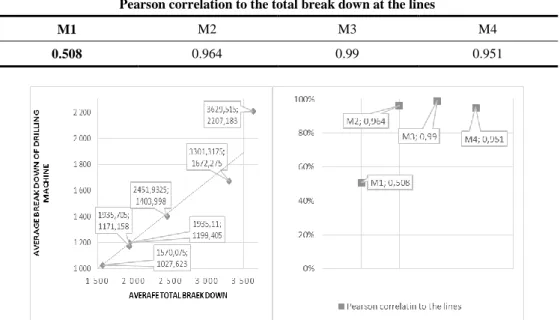
Table 6. Correlation coefficient of MTBF and MTTR with the number of items produced
on the lines
Pearson correlation to the total break down at the lines
M1 M2 M3 M4
0.508 0.964 0.99 0.951
Fig. 4. Dependencies of line and driling machines breakdowns with trend line for avarage
drilling machine breakdowns and plot for the Pearson correlation (source: own)
As shown in Table 5, the ratio of dependence highlights high weight of influ-ence on the technical performance of all lines producing pine components being a part of finished product. In the case of group of machines, each failure pf drilling machines causes system disability, and such a line cannot produce. At described above line speeds may seem that the ratio of failure is not high, however, assuming that the one line produces about 5 running meters per minute, the loss due to drill-ing machine failures, assumdrill-ing stop times of 1000 minutes a month will give 5000 running meters of ready elements missing. The loss of such, production can take as calculated waste or lack of one line, but in observing the growing trend of down-time due to problems with drilling machines, and a mirrored their potential value because of two lines in each plant, the company decided to take common preven-tive actions. Confirming the validity of the failure tendency, to reduce the level of quality as a result of a breakdown in drilling operation, plants have decided to ap-point a joint committee made of the operators, foremen and maintenance workers. Commission with the tools used in the company to identify the problem (method 5 Why and Ishikawa diagram) conducted an analysis of the causes of non-com-pliance (Fig. 5)
During analysis, particular attention was focused on the technical aspect of the device, because the analysis of the human factor to the long downtimes, often
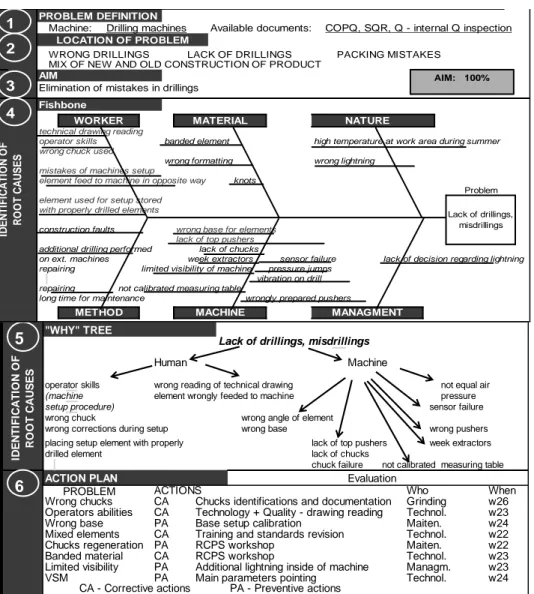
grounds on the management method. Striving to fulfil production plan in case the machine is repaired long time and cannot produce moving task for another shift, causes frustration both the operator and the other people responsible for the process execution. A proper understanding of the failure causes can develop a strategy for the repair of machines and focus more efforts on the process of drilling by the maintenance services, operator, but also quality controllers, who can often make correct drilling measurements. Based on the knowledge and experience, interpreta-tion of the most commonly caused cases of failure drills has been made. Conclu-sion shows Table 7. Root Case Problem Solving:
PROBLEM DEFINITION
Machine: Drilling machines Available documents: COPQ, SQR, Q - internal Q inspection WRONG DRILLINGS LACK OF DRILLINGS PACKING MISTAKES
MIX OF NEW AND OLD CONSTRUCTION OF PRODUCT
AIM
Elimination of mistakes in drillings
Fishbone
technical drawing reading
operator skills banded element high temperature at work area during summer
wrong chuck used
wrong formatting wrong lightning
mistakes of machines setup
element feed to machine in opposite way knots
element used for setup stored with properly drilled elements
construction faults wrong base for elements lack of top pushers
additional drilling performed lack of chucks
on ext. machines week extractors sensor failure lack of decision regarding lightning repairing limited visibility of machine pressure jumps
vibration on drill repairing not calibrated measuring table
long time for maintenance wrongly prepared pushers
Update: 17-01-2014
RCPS - Drilling operation mistakes and breakdowns
LOCATION OF PROBLEM Date: 22.05.2013r ID E N T IF IC A T IO N O F R O O T C A U S E S NATURE MATERIAL WORKER Lack of drillings, misdrillings Problem
METHOD MACHINE MANAGMENT
1 2
4
3 AIM: 100%
"WHY" TREE
Lack of drillings, misdrillings
Human Machine
operator skills wrong reading of technical drawing not equal air (machine element wrongly feeded to machine pressure
setup procedure) sensor failure
wrong chuck wrong angle of element
wrong corrections during setup wrong base wrong pushers placing setup element with properly lack of top pushers week extractors drilled element lack of chucks
chuck failure not calibrated measuring table
ACTION PLAN Evaluation
ACTIONS Who When
Wrong chucks CA Chucks identifications and documentation Grinding w26 Operators abilities CA Technology + Quality - drawing reading Technol. w23
Wrong base PA Base setup calibration Maiten. w24
Mixed elements CA Training and standards revision Technol. w22
Chucks regeneration PA RCPS workshop Maiten. w22
Banded material CA RCPS workshop Technol. w23
Limited visibility PA Additional lightning inside of machine Managm. w23
VSM PA Main parameters pointing Technol. w24
CA - Corrective actions PA - Preventive actions PROBLEM ID E N T IF IC A T IO N O F R O O T C A U S E S 5 6 C E
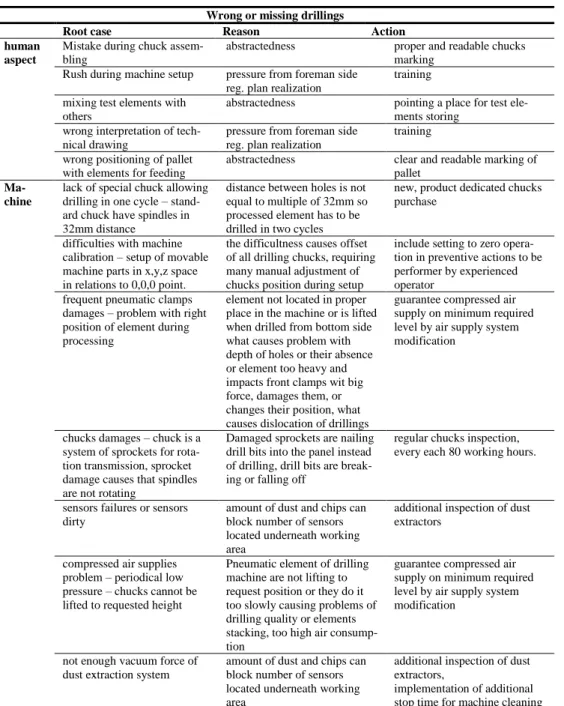
Table 7. Reasons of wrong or missing drillings
Wrong or missing drillings
Root case Reason Action
human aspect
Mistake during chuck assem-bling
abstractedness proper and readable chucks marking
Rush during machine setup pressure from foreman side reg. plan realization
training mixing test elements with
others
abstractedness pointing a place for test ele-ments storing
wrong interpretation of tech-nical drawing
pressure from foreman side reg. plan realization
training wrong positioning of pallet
with elements for feeding
abstractedness clear and readable marking of pallet
Ma-chine
lack of special chuck allowing drilling in one cycle – stand-ard chuck have spindles in 32mm distance
distance between holes is not equal to multiple of 32mm so processed element has to be drilled in two cycles
new, product dedicated chucks purchase
difficulties with machine calibration – setup of movable machine parts in x,y,z space in relations to 0,0,0 point.
the difficultness causes offset of all drilling chucks, requiring many manual adjustment of chucks position during setup
include setting to zero opera-tion in preventive acopera-tions to be performer by experienced operator
frequent pneumatic clamps damages – problem with right position of element during processing
element not located in proper place in the machine or is lifted when drilled from bottom side what causes problem with depth of holes or their absence or element too heavy and impacts front clamps wit big force, damages them, or changes their position, what causes dislocation of drillings
guarantee compressed air supply on minimum required level by air supply system modification
chucks damages – chuck is a system of sprockets for rota-tion transmission, sprocket damage causes that spindles are not rotating
Damaged sprockets are nailing drill bits into the panel instead of drilling, drill bits are break-ing or fallbreak-ing off
regular chucks inspection, every each 80 working hours.
sensors failures or sensors dirty
amount of dust and chips can block number of sensors located underneath working area
additional inspection of dust extractors
compressed air supplies problem – periodical low pressure – chucks cannot be lifted to requested height
Pneumatic element of drilling machine are not lifting to request position or they do it too slowly causing problems of drilling quality or elements stacking, too high air consump-tion
guarantee compressed air supply on minimum required level by air supply system modification
not enough vacuum force of dust extraction system
amount of dust and chips can block number of sensors located underneath working area
additional inspection of dust extractors,
implementation of additional stop time for machine cleaning
While part of the problem can be eliminated by purchasing special chucks and by proper supervision of their designation and service, the compressed air failures and pneumatic clams’ damages can be reduced by slowing the speed of the line.
Large and heavy items from the pine glue boards, entering slowly to drill, with less force hits the clamps, extending their service life and efficiency at the same time. As a result, factories returning to three-shift production system has decided to slow down the line speed for large items that passed with big force on the chain con-veyor caused damage to positioning clamps. The proposed improvement actions are currently in progress.
6. CONCLUSION
The production process is not only the manufacturing process, but also the process of preparation for the workmanship based on technical condition of the machines. Wide range of available indicators, not always have correlations among themselves, but helps to determine the appropriate corrective strategies.
Enterprises that use indicators should clearly and precisely define their scope. Exact analysis can help avoiding extending a working time with another shift, what leads very often to 4-brigade system of work what is very inconvenient for work-ers. In a situation where these machines are the bottlenecks in the production proc-ess, it becomes a key aspect for the enterprise performance. Therefore proper selec-tion of measures and their assessment of the consequences can bring relaxaselec-tion and systematization of jobs. It can lead to a change of perception in managing group, increase effectiveness and capacity what allows for new products implementation.
ACKNOWLEDGEMENTS
We would like to acknowledge Professor Czesław Cempel of the Faculty of Mechanical Engineering and Management at Poznan University of Technology. We are indebted to Professor Czesław Cempel for his very valuable comments concerning this article.
REFERENCES
Adamkiewicz A. & Burnos A. (2012), Kluczowe wskaźniki efektywności w utrzymaniu silników spalinowych w układach energetycznych jednostek pływających, Zeszyty Naukowe Marynarki Wojennej, Szczecin, Vol. 53, No. 2(189), pp. 5–16.
Antosz K. & Stadnicka D. (2015), Mierniki oceny efektywności funkcjonowania maszyn w dużych przedsiębiorstwach: wyniki badań, www.ein.org.pl/sites/defult/files/2015-01-15p.pdf, (date of reading: 1 August 2016).
Bojar W.L. & Żółtowski M. (2011), Procesy wspomagania decyzji w zakresie utrzymania ruchu i eksploatacji maszyn, Studies & Proceedings Polish Association for Know-ledge Management, Bydgoszcz, No. 40, pp. 71v84.
Hartmann E. (1992), Successfully Installing TPM in a Non-Japanese Plant: Total Produc-tive Maintenance, TPM Press, Incorporated.
Jasiulewicz-Kaczmarek M. (2011), Maintenance performance – overall equipment effecti-veness, Lewandowski J., Jałmużna I. & Sekieta M., (eds.) Improvement of produc-tion processes, A series of monographs, Lodz, pp. 71–91.
Loska A. (2013), Exploatation assesment of selected technical objects using taxonomic methods, Eksploatacja i Niezawodność – Maintenance and Reliability, Vol. 15(1), No. 1, pp. 1–8.
Nakajima S. (1988), Introduction to TPM: Total Productive Maintenance, Productivity Press, Cambridge, MA, USA.
Pourjavad E., Shirouyehzad H. & Shahin A. (2011), Analyzing RCM Indicators in Continuous Production Lines A Case Study, International Business Research, Vol. 4, No. 4.
Szwedzka K., Lubiński P. & Jasiulewicz-Kaczmarek M., (2014), Redukcja czasu przez-brojeń metodą SMED – studium przypadku, Logistyka, No.6, pp. 14816–14825. Szwedzka K., Jasiulewicz- Kaczmarek M. & Szafer P. (2015), The efficiency of production
equipment improvement – a case study, Research in Logistics & Production, Vol. 5, No. 5, pp. 445–457.
Zółtowski B. (1996), Podstawy diagnostyki maszyn, Wydawnictwo Uczelniane Akademii Techniczno-Rolniczej, Bydgoszcz.
BIOGRAPHICAL NOTES
Katarzyna Szwedzka is a doctor degree student at Faculty of Engineering
Mana-gement in Poznan University of Technology. She came to University with exten-sive experience in industry. Her research interests are production engineering and maintenance. She is the co-author of a few publication of industry concept so far.
Małgorzata Jasiulewicz-Kaczmarek is an assisting professor of Poznan
University of Technology. Author or co-author of about 100 scientific publications. Her research interests are engineering management, especially in maintenance management, quality management, sustainable development.
!["Deutschland im zweiten Weltkrieg, t. 4", red. Wolfgang Schumann, Berlin 1981 : [recenzja]](data:image/gif;base64,R0lGODlhAQABAIAAAP///wAAACH5BAEAAAAALAAAAAABAAEAAAICRAEAOw==)