Przedmowa
384
0
0
Pełen tekst
(2) Rada Naukowa Czasopisma Przewodniczący prof. dr hab. Jerzy Kujawa. Członkowie prof. dr hab. Ewa Polak prof. dr hab. Janusz Żurek dr hab. Krzysztof Dobrowolski, prof. UG. Recenzenci dr hab. Czesława Christowa, prof. ZUT, dr hab. Hanna Klimek, prof. UG, prof. dr hab. Jerzy Kujawa, dr Michał Igielski, dr Alicja Januszewicz, dr Magdalena Klopott, dr Robert Marek, dr Wojciech Piotrowicz, dr Ilona Urbanyi-Popiołek, dr Krystyna Wasilewska. Redaktor Wydawnictwa Katarzyna Ambroziak. Skład i łamanie Maksymilian Biniakiewicz. Zeszyty Naukowe Uniwersytetu Gdańskiego Studia i Materiały Instytutu Transportu i Handlu Morskiego Nr 13. Wersja papierowa w języku polskim jest wersją pierwotną czasopisma.. © Copyright by Uniwersytet Gdański. ISSN 2080-6302. Wydawnictwo Uniwersytetu Gdańskiego ul. Armii Krajowej 119/121, 81-824 Sopot tel./fax 58 523 14 83 e-mail: wydawnictwo@ug.edu.pl www.wyd.ug.edu.pl Księgarnia internetowa: www.kiw.ug.edu.pl.
(3) SpiS treści Wspomnienie o doktorze Karolu Krefcie (6.03.1964−29.09.2016) . . . . . . . . . . . . . . . . . . 5 Przedmowa . . . . . . . . . . . . . . . . . . . . . . . . . . . . . . . . . . . . . . . . . . . . . . . . . . . . . . . . . . . . . . . . 7 TRANSPORT I HANDEL MORSKI Ernest Czermański Container shipping development for world trade . . . . . . . . . . . . . . . . . . . . . . . . . . . . . . 13 Robert Marek Rola port community system w portach morskich . . . . . . . . . . . . . . . . . . . . . . . . . . . . . . . . 30 Ryszard K. Miler Koncepcja zintegrowanego systemu monitoringu bezpieczeństwa transportu morskiego . . . . . . . . . . . . . . . . . . . . . . . . . . . . . . . . . . . . . . . . . . . . . . . . . . . . . . 43 Katarzyna Zofia Gdowska, Roger Książek Model matematyczny dla problemu synchronizacji regularnych połączeń liniowych w celu minimalizacji czasu dostaw . . . . . . . . . . . . . . . . . . . . . . . . . 65 Joanna Miklińska Rozwój infrastruktury transportowo-logistycznej w Polsce dla realizacji operacji łańcuchów dostaw – wybrane zagadnienia na przykładzie korytarza transportowego Bałtyk−Adriatyk . . . . . . . . . . . . . . . . . . . . . 76 Marcin Kalinowski, Rafał Koba, Urszula Kowalczyk Międzynarodowa droga wodna E-40 jako potencjalny generator podaży ładunków dla portów bałtyckich . . . . . . . . . . . . . . . . . . . . . . . . . . . . . . . . . . . . . 97 Adam Salomon Funkcjonowanie przyportowych centrów logistycznych w Polsce . . . . . . . . . . . . . . . 113 Alicja Wasilewska, Roksana Wilgocka, Adam Przybyłowski Stan i perspektywy rozwojowe technologii offshore na przykładzie morskich farm wiatrowych . . . . . . . . . . . . . . . . . . . . . . . . . . . . . . . . . . . 135 PRZEDSIĘBIORSTWO W OTOCZENIU GLOBALNYM Ewa Ignaciuk, Sylwia Machowska-Okrój Przedsiębiorczość jako czynnik wzrostu i rozwoju społeczno-gospodarczego . . . . . 149 Maciej Mikliński Legal aspects of selected modern methods of payment . . . . . . . . . . . . . . . . . . . . . . . . 169.
(4) 4. Spis treści. Adam Damrath Wpływ globalnego kryzysu finansowego na sytuację ludzi młodych na rynkach pracy w krajach Unii Europejskiej . . . . . . . . . . . . . . . . . . . . . . . . . . . . . . . . 180 Olga Dębicka, Aneta Oniszczuk-Jastrząbek Concept of measuring a sustainable development of a company . . . . . . . . . . . . . . . . 192 Agnieszka Hajduk Struktura majątku przedsiębiorstwa jako czynnik oddziałujący na wybór źródeł finansowania jego działalności . . . . . . . . . . . . . . . . . . . . . . . . . . . . . . 211 Patrycja Trojczak-Golonka, Julita Stańczuk Specyfika preprocessingu danych finansowych . . . . . . . . . . . . . . . . . . . . . . . . . . . . . . . 224 Jędrzej Charłampowicz Tworzenie wartości przez łańcuch dostaw typu leagile – wybrane aspekty . . . . . . . . 236 Bożena Kłusek-Wojciszke Wpływ osobowości menedżera na postawy wobec konfliktu w organizacjach . . . . 245 Michał Igielski Outsourcing jako metoda zarządzania współczesnym przedsiębiorstwem – studium przypadku polskich przedsiębiorstw . . . . . . . . . . . . . . . . . . . . . . . . . . . . . . . . 257 Eugeniusz Gostomski, Tomasz Michałowski Przesłanki tworzenia i zaawansowanie europejskiej unii kapitałowej . . . . . . . . . . . . 276 Joanna Bednarz, Justyna Rutecka Znaczenie marki i lojalności nabywców w sektorze bankowym . . . . . . . . . . . . . . . . . 288 Anetta Waśniewska Funkcjonowanie organizacji pożytku publicznego w Polsce . . . . . . . . . . . . . . . . . . . . 301 Michał Igielski Istota kapitału intelektualnego w polskich przedsiębiorstwach z branży TSL . . . . . 314 Adam Salomon Proces spedycyjny i logistyka magazynowa w przedsiębiorstwach sektora TSL w Polsce . . . . . . . . . . . . . . . . . . . . . . . . . . . . . . . . . . . . . . . . . . . . . . . . . . . . . . 332 BIZNES ELEKTRONICZNY Jowita Świerczyńska E-usługi w obsłudze celnej − wybrane aspekty z punktu widzenia działań kontrolnych w ruchu granicznym . . . . . . . . . . . . . . . . . . . . . . . . . . . . . . . . . . . 363 Piotr Brudło Klasyfikacja instrumentów marketingowych w orientacji na klienta dla witryn internetowych w rynkowym segmencie B2C . . . . . . . . . . . . . . . . . . . . . . . 376 Informacje o autorach . . . . . . . . . . . . . . . . . . . . . . . . . . . . . . . . . . . . . . . . . . . . . . . . . . . . . 384.
(5) WSpomnienie o DoktorZe karolu krefcie (6.03.1964−29.09.2016) W dniu 29 września 2016 r. po krótkiej chorobie odszedł dr Karol Kreft, nasz kolega, nauczyciel i popularyzator wiedzy o nowoczesnych technologiach informacyjnych i informatycznych, długoletni pracownik Instytutu Transportu i Handlu Morskiego Uniwersytetu Gdańskiego. Całe swoje życie zawodowe związał z naszym Instytutem, gdzie na stanowisku asystenta podjął pracę w 1991 r. po ukończeniu studiów na Wydziale Oceanotechniki i Okrętownictwa Politechniki Gdańskiej. To tu pod kierunkiem prof. Ludwika Kondratowicza napisał i obronił rozprawę doktorską pt. Komputerowe modele sieci neuronowych jako narzędzia prognozowania w lądowo-morskim łańcuchu transportowym, dotyczącą wykorzystania sztucznych sieci neuronowych w prognozowaniu ekonomicznym. I tu także pracował nad swoim ostatnim, niestety nieukończonym dziełem, monografią mającą stać się jego rozprawą habilitacyjną, opisującą jego własną metodę wyznaczania optymalnych nakładów na bezpieczeństwo w systemach informatycznych. W latach 2005−2012 pełnił funkcję kierownika Zakładu Gospodarki Elektronicznej oraz opiekuna specjalności Biznes Elektroniczny, przez kilka lat opiekował się też Kołem Naukowym Biznesu Elektronicznego i trzeba przyznać, że wówczas przeżywało ono okres swojej świetności. Zainteresowania naukowe dr. Karola Krefta i będące ich wyrazem publikacje koncentrowały się na problematyce sztucznych sieci neuronowych, outsourcingu usług informatycznych, bezpieczeństwa w gospodarce elektronicznej, zarządzania bezpieczeństwem informacji, ryzyka w systemach informatycznych, a także efektywności utrzymania zabezpieczeń.
(6) 6. Wspomnienie o doktorze Karolu Krefcie. w systemie ochrony informacji. Z tymi zainteresowaniami naukowymi związana była działalność dydaktyczna doktora. Przygotował on autorskie programy nauczania licznych przedmiotów oferowanych na Wydziale Ekonomicznym Uniwersytetu Gdańskiego, dotyczące m.in. gospodarki elektronicznej, sieci komputerowych i systemów operacyjnych, systemów eksperckich, baz danych w zarządzaniu, prognozowania i symulacji, technologii informacyjnych, zarządzania bezpieczeństwem danych. Za swoją pracę został odznaczony Brązowym Medalem za Długoletnią Służbę oraz szczególnie przez niego cenionym Medalem Komisji Edukacji Narodowej. Karol Kreft był wyjątkowym nauczycielem akademickim, bardzo życzliwym studentom, wyrozumiałym, cierpliwym, potrafiącym tłumaczyć skomplikowane zagadnienia, wykazującym partnerski stosunek do każdego studenta i bardzo sympatycznym, a także dowcipnym, co przyciągało do niego tłumy studentów, również na seminariach magisterskich i licencjackich. Był człowiekiem wyjątkowym także z powodu swoich licznych zainteresowań, pasji i aktywności. Bardzo dbał o równowagę pomiędzy pracą a pozostałymi sferami życia. Żył bardzo szybko i niekiedy miał poczucie bezpowrotnie upływającego niewłaściwie wykorzystanego czasu. Niekiedy wydawało mu się, że nie zdąży wystarczająco długo nacieszyć się radością, jaką czerpał, oddając się swoim zainteresowaniom (niektóre dzielił ze swoim ukochanym synem). Z ogromną przyjemnością żeglował po mazurskich jeziorach, jeździł na nartach lub snowboardzie, a także na rowerze, uprawiał kitesurfing, nurkował, ale przede wszystkim był motocyklistą. Radość, jaką czerpał z jazdy motocyklem, była nieporównywalna z radością z każdej innej pasji. Bywało, że ocierał się o śmierć, na motocyklu lub pod wodą, ale to tylko motywowało go do doskonalenia swoich umiejętności. Był odważny, nie bał się nowych wyzwań, a czasami wręcz kusił los. Karol Kreft był też naszym kolegą z pracy. Na Wydziale Ekonomicznym, na którym pracował przez prawie ćwierć wieku, był lubiany i szanowany, choć nie wszyscy byli jego fanami. Bywał uparty − przekonany o swojej racji zaciekle bronił własnego stanowiska. Zawsze życzliwy, chętnie pomagał innym. Był skromny, mądry i wyjątkowo cenił lojalność. Ciekawie opowiadał o swoich przygodach, był bardzo dowcipny, miał także ogromny dystans do samego siebie i swoich osiągnięć. Był również wspaniałym przyjacielem. Podobno, jak mówił Julian Tuwim, trzeba żyć tak, żeby znajomym było nudno po naszej śmierci, i właśnie tak przyjaciele Karola czują się w obliczu tej ogromnej straty. W imieniu przyjaciół Karola − Hanna Klimek.
(7) przedmowa W trzynastym numerze Studiów i Materiałów Instytutu Transportu i Handlu Morskiego opublikowano artykuły nadesłane na konferencję InfoGlobMar 2016, zorganizowaną przez Instytut Transportu i Handlu Morskiego Uniwersytetu Gdańskiego we współpracy z Katedrą Logistyki i Systemów Transportowych oraz Katedrą Ekonomii i Zarządzania z Akademii Morskiej w Gdyni. Zakres tematyczny konferencji obejmował: problematykę lądowo-morskich systemów transportowych, problematykę systemów informatycznych i ryzyka w działalności gospodarczej, a także problematykę funkcjonowania przedsiębiorstw w otoczeniu globalnym. Podczas konferencji odbyła się też debata samorządowców i praktyków gospodarczych poświęcona inteligentnym specjalizacjom Pomorza. Głównym celem konferencji była wymiana poglądów, opinii i doświadczeń pracowników nauki, samorządowców i praktyków gospodarczych. Zamieszczone w trzynastym numerze Studiów artykuły prezentują wyniki badań pracowników różnych ośrodków naukowych, tj. Instytutu Transportu i Handlu Morskiego Uniwersytetu Gdańskiego, Akademii Morskiej w Gdyni, Akademii Marynarki Wojennej w Gdyni, Politechniki Gdańskiej, Akademii Górniczo-Hutniczej w Krakowie, Krakowskiej Akademii im. Andrzeja Frycza Modrzewskiego, Wyższej Szkoły Bankowej w Gdańsku. Publikacja została podzielona na trzy części poświęcone najważniejszym obszarom badawczym Instytutu, czyli zagadnieniom transportu i handlu morskiego, funkcjonowania współczesnych przedsiębiorstw w otoczeniu globalnym oraz gospodarki elektronicznej. Pierwsza część publikacji, poświęcona problematyce transportu i handlu morskiego, zawiera osiem artykułów. Pierwszy z nich dotyczy funkcjonowania i perspektyw rozwoju żeglugi kontenerowej. Wskazano w nim czynniki sprzyjające i utrudniające rozwój żeglugi kontenerowej na świecie, w szczególności te związane z rynkami paliwowymi. Drugi artykuł poświęcono istocie port community system i jego rozwojowi w portach morskich krajów wysoko rozwiniętych. Przedstawiono w nim przykładowe systemy typu port community funkcjonujące w wybranych portach morskich. Opisano korzyści i nakłady związane z wdrażaniem oraz koszty utrzymania takiego systemu informacyjnego. Kolejny artykuł omawia problem bezpieczeństwa transportu morskiego, a w szczególności integracji systemów jego monitoringu. Zwrócono tu uwagę na konieczność standaryzacji i centralizacji systemów monitoringu bezpieczeństwa transportu morskiego i przedstawiono koncepcję zintegrowanego systemu.
(8) 8. Przedmowa. monitoringu bezpieczeństwa transportu morskiego, opartą na holistycznej analizie zidentyfikowanych determinant bezpieczeństwa morskiego w układzie kwartylowym. W następnym artykule zaprezentowano model programowania całkowitoliczbowego mieszanego dla zadania synchronizacji harmonogramu wahadłowych rejsów statków w liniowej żegludze kontenerowej na danym akwenie. Stanowi on pierwszy etap poszukiwania rozwiązania szerszego problemu (przy zastosowanym podejściu hierarchicznym), jakim jest synchronizacja połączeń w celu minimalizacji czasu dostaw w żegludze regularnej. Zmianom (i czynnikom wpływającym na nie), którym podlegają współczesne międzynarodowe łańcuchy dostaw, poświęcony jest kolejny artykuł w tej części Studiów. Podkreślono w nim konieczność zapewnienia odpowiedniej infrastruktury transportowo-logistycznej, niezbędnej do organizacji sprawnych przepływów ładunków w tych łańcuchach. W artykule zwrócono ponadto uwagę na ważną rolę, jaką odgrywają w Polsce korytarz transportowy Bałtyk−Adriatyk oraz specjalne strefy ekonomiczne. Potencjał przewozowy międzynarodowej drogi wodnej E-40, stanowiącej element sieci dróg wodnych śródlądowych o znaczeniu ponadnarodowym, omówiono w kolejnym artykule. Przedstawiono ją jako swoisty łącznik dwóch akwenów, tj. Morza Bałtyckiego i Morza Czarnego, oraz trzech krajów, tj. Polski, Białorusi i Ukrainy. Przy uwzględnieniu potencjału gospodarczego tych krajów oraz obecnej wielkości ich wymiany towarowej droga wodna E-40 stanowi potencjalny generator ładunków nie tylko dla polskich portów morskich, lecz także dla pozostałych portów basenu Morza Bałtyckiego (w artykule zaprezentowano wyniki badań rynkowych dotyczących aktualnej podaży ładunków ciążących do transportu wodnego śródlądowego). Problematyki funkcjonowania i rozwoju centrów logistycznych w portach morskich i na ich zapleczu dotyczy następny artykuł w tej części Studiów. Opisano w nim charakterystyczne cechy oraz funkcje tych elementów sieci logistycznej, a także przedstawiono przypadki portowych centrów logistycznych w Polsce (w portach Trójmiasta i zachodniego wybrzeża) oraz na zapleczu portowym (w Gliwicach i planowanego suchego portu w Zajączkowie Tczewskim). Aktualny stan i perspektywy rozwoju sektora offshore w odniesieniu do morskich farm wiatrowych są przedmiotem rozważań podjętych w następnym artykule. Przedstawiono w nim europejskie uwarunkowania funkcjonowania tego sektora, a także jego potencjał w Polsce. Omówiono tu też działania na rzecz jego rozwoju w województwie pomorskim. Druga część publikacji, dotycząca funkcjonowania przedsiębiorstw w otoczeniu globalnym, zawiera czternaście artykułów. Pierwszy z nich dotyczy przedsiębiorczości, jako czynnika wzrostu i rozwoju społeczno-gospodarczego. Przedstawiono w nim znaczenie przedsiębiorczości w stymulowaniu wzrostu i rozwoju społeczno-gospodarczego kraju oraz dokonano analizy działalności aktywizującej przedsiębiorczość..
(9) Przedmowa. 9. Drugi artykuł zawiera rozważania na temat nowoczesnych sposobów zapłaty w świetle zmieniającej się istoty pieniądza i jego funkcjonowania. W celu zarysowania typowych sposobów rozwiązania prawnych problemów posługiwania się współczesnymi sposobami zapłaty przedstawiono tu wybrane elementy złożonych prawnych zagadnień pieniądza i zapłaty. Sytuację młodych ludzi na rynkach pracy w krajach Unii Europejskiej omówiono w kolejnym artykule tej części Studiów. Szczególną uwagę zwrócono na problem globalnego kryzysu finansowego z pierwszej dekady XXI w., którego skutki na rynkach pracy najbardziej odczuli młodzi Europejczycy (w latach 2007−2012 największy przyrost bezrobocia odnotowano wśród młodych, aktywnych zawodowo mieszkańców krajów unijnych). W kolejnym artykule poruszono problem zrównoważonego rozwoju przedsiębiorstwa, przedstawiając autorską koncepcję miernika, opracowanego na podstawie zbioru zasobów przedsiębiorstwa sprzyjających zrównoważonym zachowaniom pracowników, budującym jego zdolność konkurencyjną. Następny artykuł dotyczy wyboru źródeł finansowania działalności przedsiębiorstw. Podjęto w nim próbę oceny wpływu struktury majątku przedsiębiorstwa na kształtowanie struktury jego kapitału. Opisane w artykule wyniki badań (za lata 2005−2010) dotyczą ok. 200 spółek akcyjnych (z makrosektorów przemysłu oraz handlu i usług) notowanych na Giełdzie Papierów Wartościowych w Warszawie. Wykazano dodatnią zależność między strukturą majątku a strukturą kapitału spółek w obu makrosektorach giełdy. Specyfice preprocessingu danych finansowych poświęcono kolejny artykuł, który porządkuje wiedzę na temat danych finansowych i znaczenia ich specyfiki dla wyników powszechnie prowadzonych analiz. Zaprezentowano tu charakterystyczne cechy danych finansowych, odróżniające je od innych typów danych i wpływające na poprawność badań wykonywanych z ich użyciem. W następnym artykule, poświęconym tworzeniu wartości w łańcuchu dostaw typu leagile, dokonano przeglądu literatury w zakresie pojęć „wartość”, „łańcuch dostaw”, „zarządzanie łańcuchem dostaw”, a także koncepcji lean i agile w kontekście funkcjonowania łańcuchów dostaw, omówiono też działania wpływające na tworzenie wartości wewnątrz łańcucha dostaw typu leagile. Próbę udzielenia odpowiedzi na pytania o wpływ osobowości menedżerów na kształtowanie ich postaw wobec konfliktów podjęto w badaniu opisanym w kolejnym artykule tej części Studiów. Zaprezentowano tu przebieg i wyniki badań, które wskazały najsilniejsze dodatnie i ujemne predyktory aprobaty konfliktu. Następny artykuł dotyczy outsourcingu, jako koncepcji zarządzania, której wdrożenie może przyczynić się do osiągnięcia sukcesów rynkowych i finansowych przedsiębiorstwa. Przedstawiono w nim praktyczne aspekty outsourcingu, omówiono jego rodzaje i możliwości wykorzystania przez polskie przedsiębiorstwa. Temat europejskiej unii rynków kapitałowych poruszono w kolejnym artykule. Jej utworzenie ma stanowić następny krok na drodze do pogłębiania integracji rynków finansowych w ramach Unii Europejskiej. W artykule przedstawiono.
(10) 10. Przedmowa. genezę budowy unii europejskich rynków kapitałowych, jej cele i zasady funkcjonowania, a także działania niezbędne do jej utworzenia. Zwrócono również uwagę na kontrowersje dotyczące projektu budowy unii i postępy w jej tworzeniu. Sektorowi bankowemu poświęcono następny artykuł w tej części Studiów. Omówiono tu znaczenie posiadania przez banki wyraźnej i rozpoznawalnej marki. Uwagę skoncentrowano zwłaszcza na wpływie marki na budowanie relacji pomiędzy bankiem a klientami, co prowadzi do kształtowania uczucia satysfakcji nabywców usług bankowych i ma skutkować ich lojalnością. Kolejny artykuł poświęcono organizacjom pożytku publicznego w Polsce. Analiza danych GUS pozwoliła stwierdzić, że liczba funkcjonujących organizacji pożytku publicznego jest silnie uzależniona od liczby osób fizycznych i prawnych zaangażowanych w ich działania, a niezależna od konkretnego celu funkcjonowania organizacji. Na uwagę natomiast zasługuje fakt, że w pełni w rozwój lokalny, społeczny i ekonomiczny zaangażowanych jest niewiele organizacji (ich działania skupiają się na ratownictwie, rynku pracy i aktywizacji zawodowej oraz łowiectwie). Kapitał intelektualny we współczesnych przedsiębiorstwach, ze szczególnym uwzględnieniem branży TSL, jest przedmiotem rozważań w następnym artykule. Z przeprowadzonych przez autora badań wynika, że ten rodzaj zasobów przedsiębiorstw odgrywa coraz ważniejszą rolę w zarządzaniu organizacjami. Jest postrzegany jako kluczowy czynnik skutecznego zarządzania i innowacyjności. Ostatni artykuł w tej części Studiów dotyczy procesu spedycyjnego i logistyki magazynowej przedsiębiorstw branży TSL działających na rynkach krajowych i międzynarodowych. Najwięcej uwagi poświęcono liderowi tego rynku, którym jest DHL Supply Chain & Global Forwarding. Trzecia część Studiów, dotycząca gospodarki elektronicznej, zawiera tym razem tylko dwa artykuły. Pierwszy z nich poświęcono innowacyjnym rozwiązaniom w zakresie obsługi celnej, jakimi są usługi elektroniczne (e-usługi). Przedstawiono w nim istotę kontroli celnej, ramy strategiczne wprowadzania elektronicznych ułatwień oraz charakterystykę e-usług usprawniających obsługę celną w ruchu granicznym. Drugi artykuł dotyczy instrumentów marketingowych służących budowie oraz utrzymywaniu relacji sprzedawca − klient w segmencie B2C, wykorzystywanych w witrynie przez internetową agencję turystyczną Adriatic.hr..
(11) TraNSporT I HaNdeL morSKI.
(12)
(13) ernest czermański. container SHippinG DeVelopment For worLd Trade. SUmmarY. This analysis has been performer based on data illustrating world container shipping and additionally some other, but corresponding markets, like bunker prices. The aim of the paper is to extract and analyze micro- and macroeconomic conditions of containers shipping operating and development, in its three areas: costs and revenues. Conclusions of the analysis shows clear, that there are many important factors accelerating container shipping for it further development, as well as some important barriers slowing down the growth.. introduction to world trade trends The past 20 years have seen us grown accustomed to the role played by South-East Asian countries, especially China, as the driving force behind global trade growth. In the meanwhile India and Brazil have joined them. In more recent years, however, the growth trend has slowed significantly to an average of 2% GDP per year. Only China succeeded in maintaining its growth rate at 3 times the average GDP, while 2015 brought the first symptoms of the future collapse in the failure to attain a growth of 7% GDP per year, below which, according to some economists, it is believed that the market begins to slump. According to the estimations of experts, even India’s notable market growth of above 7% GDP will not be enough to compensate losses caused by China’s economic slowdown1. This in. 1. Trade and Development Report 2016, UNCTAD/TDR/2016, United Nations, New York and Geneva 2016..
(14) 14. Ernest Czermański. turn constitutes a valid reason to reopen the discussion on the future of container shipping, both within the global and local, Baltic perspectives. The reason is the price of crude oil on the world fuel exchange, where the prices seen in the last year, as a result of the downward trend, continue to beat records from 12 years ago (level of 28 USD/barrel was last reported in the summer 2004)2. It can be said that during the past 5 years the average oil price has decreased from over 100 USD per barrel to approx. 30 USD per barrel last year. It must be noted that this trend will most likely be maintained due to the removal of a trade embargo, which previously imposed on Iran in a deal to reduce the nuclear program in that country, was lifted on 15th January 2016. Iran immediately undertook renewed efforts to extract and trade their own crude oil, however other OPEC countries have not declared their intentions to reduce their current levels of extraction. In other words, future months are likely to see further reductions in the price and increased demand for crude oil on both the market and in the transport industries. The above sheds a light on a currently forming key trend in which outsourcing turns into the so-called near-sourcing (or in-country sourcing). This involves sourcing raw materials and/or common products locally, despite the possibility of higher prices. Considering the growth of well-being in China, it was expected that this could, at some point, be the case. Chinese decision makers have done extremely well in recognizing the problem, hence the reason why during the last 10 years they have been investing intensively in the infrastructure of both South and East African countries which by 2020 will be established as the next center of low labor and production costs. Therefore the first area of Chinese investments (and not only) was infrastructure – roads, energetic grids, telecommunication and water supplies, undertaken in order to relocate production to those areas, in a way that would be least burdensome for the investors as possible. These two factors, when considered alongside the high level of container trade dependence on the Baltic container shipping market, give grounds to claim that its further development, thereby dependence on global transport chains, is likely to be subject to substantial changes – both in quantity and direction. Besides general pro-growth factors, there are other lower scale influences which are, nevertheless, significant when it comes to separate services or ship owners, such as the removal of an import embargo placed on Iran in January 2016. Following an absence of many years of imported goods, the Iranian market is set to absorb tremendous amounts of raw materials, as well as final products, best suited to be transported by containers, in exchange for selling crude oil. Although perhaps not on such a grand scale as Iran, a similar growth rate is likely to be expected as a result of the slow re-emerging of markets in Algeria, Morocco, Tunisia, and Egypt. Even now there is growing reason for concern among European manufacturers about orders and offers of cooperation with both North and West African countries. 2. www.bankier.pl (22.01.2016)..
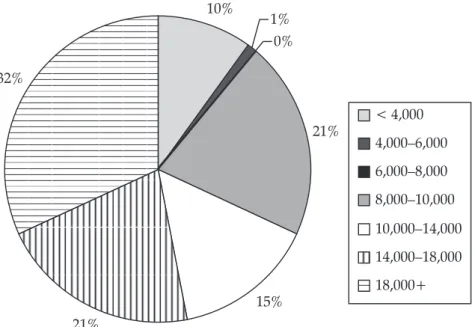
(15) Container shipping development for world trade. 15. 1. changes in container shipping costs Besides the dependence of the volume of transport work of the global container fleet on the aforementioned factors, the container shipping industry is undergoing significant changes in terms of quantity, quality, and value. In terms of the quantitative aspect, production volumes are subject to change and dependent on the share the container shipping industry currently has in global trade. Up until 2008 the average growth rate of sea turnover, as calculated by the number of containers shipped in each and every port, is equal to 11,3% and in 2007 reached 525 m TEU. The year of the crisis is notable and shows an almost 9% drop to a level of 478 m TEU. However, as can be seen in the statistics, during the following years the average growth rate did not see a return to previous levels, reaching 5,3%, only half of the previous value. If that is not enough, the forecasts for 2015 (due to a lack of data on 2015 at the time of publication) and 2016 are respectively equal to 2,2% and 3,3%3. Moreover, those forecasts are distributed unevenly from a geographical perspective since for Europe they predict a reduction in container trade by 3,0%. All other areas anticipate growth, ranging from 2,3% for South America to up to 4,9% for Arabian countries. In the quality area the most important trend in container shipping is the growth in size of the ships and their loading capacity. 2015 brought another record in terms of a container ships size at 19 224 TEU (m/v MSC Oscar) getting ahead of the famous triple-E series with a capacity of 18,271 TEU (e.g. m/v McKinney Moeller) introduced in 2013 and the m/v CSC Globe with a capacity of 19 000 TEU. Another record will be achieved in 2017 with the release of a series that includes 6 container ships with the capacity of 20 150 TEU for the Mitsui O.S.K. line (MOL) shipowners, ordered in the Korean shipyard at Samsung Heavy Industries4. It is also said that there are more orders including container ships with a capacity equal to 22 000 TEU, which certainly does not exceed their potential size limits. It can be seen (figure 1) that over the years the record has been held for increasingly shorter periods of time, whilst at the same time the size advantage of each new ship over its predecessor is decreasing. Since that time, the size of new units has increased by a few hundreds TEU each year, with increasingly larger units dominating new orders. Considering the total loading capacity of all ordered ships measured in TEU, 53% of them are ships with a capacity over 14 000 TEU, whereas 32% of the biggest ones are over 18 000 TEU (figure 2). Easy releasing and acquiring tonnage according to the current transport demands constitute a separate issue. Whilst the crisis year of 2008 was dominated by long and medium duration charters, short duration charters were defined as renting a ship for up to a year, these days, however, short duration charters are most popular starting at 1 month and do not exceed 3 months period (this is the 3. S. Rubens, Key trends in the container shipping industry, lecture during the international conference “Intermodal Europe”, Hamburg, November 2015. 4 W. Laursen, MOL orders world’s biggest container ship, “The Maritime Executive”, March 2015, http:// www.maritime-executive.com/article/ (3.02.2016)..
(16) 16. Ernest Czermański. figure 1. Capacity of the world container fleet Source: Based on: S. Rubens, Key trends in the container shipping industry, “Intermodal Europe”, Hamburg, November 2015.. duration of one passage). This makes them the most flexible arrangement allowing the ship owner to decide whether to extend the rental period to a round passage (as this is the typical duration of a medium passage between Asia-EuropeAsia or Asia-America-Asia) and providing tools to amend routes literally at the beginning of each passage. It seems, however, that container shipping market values are most crucial. In this area the most crucial indicators, which have a fundamental influence on the costs of provided transport services, and therefore both on the competitiveness of the entire transport branch and ship-owners are: the costs of ship maintenance (e.g. the price of the new vessels influencing amortization, registry costs and maintaining ability to sail and the crew salary) and the direct operational costs – voyage costs, cargo handling costs (e.g. prices of the bunker, transshipment fees and port charges). Of the previously mentioned examples it seems that only port charges are not dependent on the ship-owner and are the subject of fierce competition, however, this notion can be challenged in specific cases (there are specified premises for the port Authorities strategic considerations on allowances of specific ship-owner vessels in the event it will have significant impact on the maritime traffic and the port’s market position). The remainder of the elements which make up the cost as a whole are the source of strong competition. Purchases of the new vessels, especially container ships (and the LNG vessels) are more frequently carried out by series (vide: triple-E class ordered by Maersk Line to the amount of 10 vessels) which results in a lower production per new unit thanks to splitting the costs of.
(17) Container shipping development for world trade. 17. figure 2. Capacity structure of container ships currently on order (2015−2019) as a percentage of the total fleet loading capacity in TEU. As of November 2015 Source: Based on: S. Rubens, Key trends in the container shipping industry, “Intermodal Europe”, Hamburg, November 2015.. documentation and production costs between a number of vessels, unlike when ordering a single vessel. This trend has been accompanied by a drop in purchasing price of the container ship, as calculated per 1 slot per twenty-foot container (1 TEU). For example – the first of ‚big’ – Emma Maersk cost ca. 145 m USD, which at a nominal capacity (measured for a 10,2 t container) gives a cost of 9355 USD. The McKinney Moeller cost the ship-owner 150 m USD, so the cost of 1 slot was equal to 8210 USD. Finally, the largest container ship, MSC Oscar, cost 140 m USD, which gives 7283 USD per 1 TEU slot. This trend will most likely be maintained by the shipyards across the world, however, any further drops in unit costs will decrease. In terms of the cost of registering and maintaining ships seaworthy not much has changed. The trend which started in the 1970’s – which saw ship-owners taking up convenient flags – still continues and any national registry actions, including creating second registries, did not cause the ships to revert to their national flags. This same trend can also be seen in terms of crew costs, whereby sailors are hired from countries which have low labor costs, and also in the registry agreements in so called ‘tax heaven’ (Mann Island, St. Vincent, Cook Islands or Macau), where taxes are at a minimum (which results in a gross value equal to the net value). It is common to hire citizens of Asian countries such as: the Philippines, India, China and Indonesia. However in Europe the majority of sailors are from Russia and Ukraine5 and make up over 90% of all employed crew on 5. Challenge to the Industry. Securing Skilled Crews in Today’s Marketplace, Deloitt’s Shipping & Ports Group Report, London 2011..
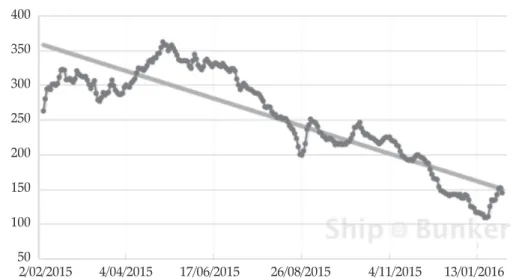
(18) 18. Ernest Czermański. figure 3. Price changes of the heavy fuel IFO380 in the past year (figures for the bunker market in Rotterdam in USD per 1 ton) Source: www.shipandbunker.com (3.02.2016).. figure 4. Price changes of the light fuel MGO in the past year (figures for the bunker market in Rotterdam in USD per 1 ton) Source: www.shipandbunker.com (3.02.2016).. the ships, however, this refers only to the lowest qualified crew members who receive the lowest wages. Crew members of higher, officer, ranks however, tend to be to a much larger extent (approx. 50%) from other regions, mostly in Europe. It seems, however, that the most interesting changes are with regards to ship operationnal costs – namely the price of bunkers. These are obviously determined by the prices of crude oil on global markets, with the exception of certain circumstances in which the balance between the structure of production and consumption of different types of those fuels is disturbed which leads to a change in price that is the mirror image of a current trend of oil price or any other marine fuel for that matter. For example, at the beginning of 2014 the majority of bunker exchanges reported an increase in the price of heavy low Sulphur fuel LSHFO.
(19) Container shipping development for world trade. 19. 380 (by approx. 10%) alongside a simultaneous decrease in the price of the light MGO fuel (by approx. 5%)6. Generally speaking however, as can be seen in figure 3 and 4, last year’s trend on the fuel exchange in Rotterdam (but not solely) showed a significant decrease in the price of both light and heavy fuels. The lowest reported prices of 1t of heavy fuel are equal to 109,00 USD (20.01.2016), and light fuel to 253,50 USD (22.01.2016)7. These prices allows ship-owners to achieve significant profits, independently of whether their vessels are in operation inside SECA (therefore using light MGO fuel to run the ship) or outside of it. Fuel consumption is one of the most crucial aspects of competitive play amongst ship-owners. As shown by a number of analyses of individual shipowners it can affect the economic efficiency of shipping both in terms of the cost of a voyage, as well as its entire enterprise. This may include: 1. unit price of bunker – which directly affects the extent of direct shipping costs. Changes in the bunker price proportionally affect fuel costs. Assuming, however, that the share of such costs in total cost of a ship-owners container activities (fixed and variable costs, excluding both the cost of the management and overhead costs) is equal to approximately 53%8, then a substantial drop in marine fuel prices may change those costs with half the intensity; 2. difference between the unit price of low-sulphur and heavy fuel (spread) – important in circumstances where a decision is made by those ship-owners, who operate entirely or partially in areas controlled by sulphur emission (SECA) and are faced with the decision whether to purchase new vessels adjusted to light low-sulphur fuels (MGO), or different – alternative fuels, or to install scrubbers on the decks of the new vessels. The lower the difference in price between the two fuels, the less profitable will be any investment in alternate fuels as a way to power the ship’s drive. The effect achieved in the past two years, which consists of lowering the spread between the prices of MGO and HFO from 294,50 USD per ton in January 2014, to 238 USD in February 2015, up until the current value of 144 USD9 that was reported in the beginning of February 2016 shows that bunker suppliers substantially weakened the legitimacy of the search for and development of alternative marine fuels; 3. bunker consumption per passage – which could be dependent on various factors: vessel’s speed, magnitude and direction of the wind, loading and the level of submergence, trim, condition of submerged hull sheathing etc. In this area the most common strategy of cost optimization is slow steaming, which is the reduction of a ship’s speed in order to lower fuel consumption where the correlation of both indicators is similar to a logarithmic function since gaining an extra unit of speed is not reflected equally in the fuel consumption, particu6. Sulphur Regulation – technology solutions and economic consequences for the Baltic Sea Region shipping market, ed. E. Czermański, Instytut Transportu i Handlu Morskiego, Sopot 2014. 7 www.shipandbunker.com (3.02.2016). 8 Sulphur content in ships bunker fuel in 2015. A study on the impacts of the new IMO regulations on transportation costs, Report of the Transport and Communication Ministry of Finland, Helsinki 2009. 9 www.shipandbunker.com (5.02.2016)..
(20) 20. Ernest Czermański. larly when cruising at higher speeds where a speed increase of 1 knot might cost an additional 10−20 tons of fuel per day. This results from the characteristics of the low torque engine room and is an approach which has been employed for many years. It saw its revival post 2008, when a significant global oversupply of tonnage was for the most part absorbed by the reduction of the ship’s speed on regular routes with the simultaneous addition of one or two more vessels per route in order to maintain the frequency of arrivals; 4. efficiency of fuel consumption per ship’s capacity unit – results from the trend of growth amongst container ships. Modern vessels are increasingly equipped with more efficient engine rooms, therefore in calculating a ship’s capacity (1 slot) in a given period (e.g. a year) the fuel consumption decreases. The example of the ship-owner Hapag-Lloyd shows that in the past three years it was possible to reduce the usage of fuel per 1 slot from 4,09 tons to 3,44 tons; 5. efficiency of fuel consumption per transported cargo unit – the most reliable indicator which shows fuel costs per transported cargo unit (1 TEU). Based on the previous indicator, however, it additionally takes into account the factor of cargo bay utilization per year. This factor is highly dependent on the route on which the ship operates; the longer the route, the less containers can be transported in 1 slot per year. For the abovementioned example of Hapag-Lloyd’s, the analogical decrease of the unit fuel consumption, here however calculated per 1 TEU in analogical period, is equal to almost 11,5% of the value of 0,52 ton down to 0,46 ton per 1 TEU. The difference in the decrease rate of the last two factors in the quoted example may suggest that the number of containers transported by the ship-owner during a year has decreased, since otherwise the factor of fuel consumption per TEU would have also decreased by 15%.. 2. revenues changes in world container shipping The revenues generated by container shipping re equal to its economic efficiency, the most important element being the freight rates, as well as and different kinds of additional surcharges for different circumstances. Freight rates are the most crucial ingredient of a container ship-owners income, however, they are largely the result of one’s current market position. As can be seen in fig. 5, the last two years have seen two important occurrences. Firstly, the big pendulum change, which, although previously recognized, is clearly visible here. During the period between every October and the February of the next year (which coincide with the Chinese New Year, a fairly significant period for short term economic conditions in China) the fluctuations amplitude is spread out in time, however, in the rest of its span it does not undergo any substantial volume changes, only changes in its frequencies. It can be said by measuring the cycle weekly that there is an increase in freight rates usually at the beginning of each month, but as it goes on the rates begin to decrease again. The second phenomenon is visible only.
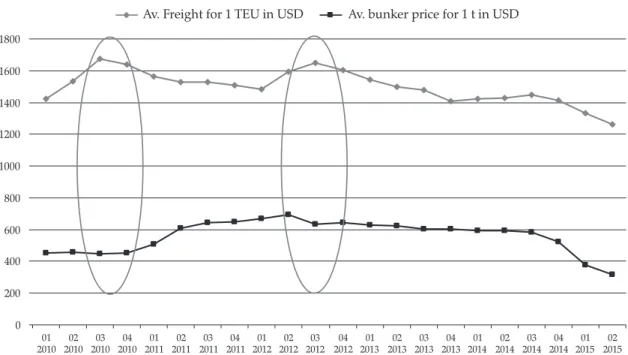
(21) Container shipping development for world trade. 21. figure 5. Comparison of weekly freight rates for 40’ container (1 FEU) on Asia – Western Europe route in 2014−2015 in USD Source: Based on: S. Rubens, Key trends in the container shipping industry, “Intermodal Europe”, Hamburg, November 2015.. after overlapping both years on the same figure. Seasonality, lets call it weekly-monthly still remains. Curve rates in 2015 have, however, been subject to parallel downward shift, which means that this year was relatively worse for ship-owners than 2014. It needs to be highlighted that freight rates are no more the direct result of crude oil prices than of bunker prices. As analysis of Hapag-Lloyd shows, in the past five years the inverse correlation of marine fuel and freight rates (figure 6) occurred up to 3 times. This means that level of freight rates has a much greater influence than that of fuel price pressure on the individual effectiveness calculations of ship-owners. The better revenues match the frequently shifting fuel prices, ship-owners permanently implemented bunker adjustment factor (BAF) into their freight rates, as well as the latest additions for entering the SECA zones requiring bunker change, which appear under various names: LSS (low sulphur surcharge), MGO BAF, SECA surcharge etc. Both elements – basic rates and additional surcharges are used simultaneously by ship-owners in order to realize certain price polices at certain times. At the beginning of 2015, at the time of the sulphur directive as well as a decrease trend in the value of crude oil, some container ship-owners noticeably reduced BAF (sometimes down as far as zero) leaving the basic rates unchanged, others, however, altered entire freight rates by more or less lowering the basic rates and adding at the same time the LSS. It seems, however, that any improvement in the ship owner’s income through manipulation of the freight rates or additional rate charges are rather limited. In the other case mentioned above, the frequently changing short-term freight rates, mentioned earlier, along with their regular frequency were limited or just removed. The undertaking of such actions by ship-owners is only able have to.
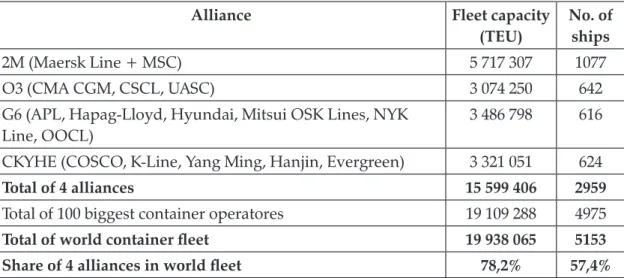
(22) 22. Ernest Czermański. figure 6. Correlation of average freight rate in USD per 1 TEU to average Hapag-Lloyd bunker price in 2010−2015 (I half) Source: Own calculation based on internal data of Hapag-Lloyd AG, Hamburg 2015.. have a very minor, short term effect on their competitive position. As such they are much more dependent on the external economic conditions. Ship-owners can influence quite significantly the character of the market. There has been a tendency, as manifested by liner shipping (especially container shipping) to concentration the market, and in the worst possible scenario to a form a markets structure similar to that of an oligopoly. This results from the necessity for ship-owners to bear significant fixed costs in order to maintain the shipping lines, irrespective of the volume of cargo on that route. In such cases competition between ship-owners no longer concerns only the economic efficiency of one passage, but the entire area of fixed costs, service organization model and the sales agency network etc. Therefore ship-owners are more inclined to, and by any means, bring about a situation in which, independently of the number of operators providing transport services on a certain route, they are still able to dictate the market conditions in as many areas as possible. Hence we can find many examples of relations in which we have only one or two, or sometimes a few ship-owners, however, they are mostly in some kind of cooperation agreement, or at least there is an agreement not to compete on price. There are, therefore many forms of such cooperation, starting with the most loose type of shipping conferences, through to shared freight rates, split services, up to alliances based on shared passage schedules, shared slots on each others vessels and combined services between vessels that belongs to an alliance. This process has been in place for over twenty years, while the past five years have seen the culmination of the formation of container ship-owners alliances. Currently there are 4 major alliances which span the entire globe, representing over 78% of world tonnage in term of loading capacity (Table 1), and over 57% in terms of vessels..
(23) 23. Container shipping development for world trade. table 1. Container fleet of the 4 biggest alliances as compared to the entire container fleet on a global scale alliance. fleet capacity (teu). no. of ships. 2M (Maersk Line + MSC). 5 717 307. 1077. O3 (CMA CGM, CSCL, UASC). 3 074 250. 642. G6 (APL, Hapag-Lloyd, Hyundai, Mitsui OSK Lines, NYK Line, OOCL). 3 486 798. 616. CKYHE (COSCO, K-Line, Yang Ming, Hanjin, Evergreen). 3 321 051. 624. total of 4 alliances. 15 599 406. 2959. Total of 100 biggest container operatores. 19 109 288. 4975. total of world container fleet. 19 938 065. 5153. 78,2%. 57,4%. Share of 4 alliances in world fleet. Source: Own elaboration based on data from the Alphaliner service: www.alphaliner.com (5.02.2016). table 2. Top 17 World’s container shipping-owners by alliances No.. Ship-owner (alliance). fleet capacity in TeU. no. of ships. 1. APM-Maersk (2M). 3 028 702. 588. 2. Mediterranean Shg Co. (2M). 2 688 605. 489. 3. CMA CGM Group (O3). 1 816 730. 457. 4. Evergreen Line (CKYHE). 939 887. 192. 5. Hapag-Lloyd (G6). 938 516. 175. 6. COSCO Container L. (CKYHE). 854 885. 166. 7. CSCL (O3). 708 396. 127. 8. Hamburg Süd Group. 643 552. 131. 9. Hanjin Shipping (CKYHE). 620 770. 101. 10. OOCL (G6). 575 846. 106. 11. MOL (G6). 568 493. 97. 12. UASC (O3). 549 124. 58. 13. APL (G6). 535 007. 85. 14. Yang Ming Marine Transport Corp. (CKYHE). 525 236. 99. 15. NYK Line (G6). 479 489. 97. 16. Hyundai M.M. (G6). 389 447. 56. 17. K Line (CKYHE). 380 273. 66. Source: Own elaboration based on data from the Alphaliner service: www.alphaliner.com (5.02.2016).. The sheer scale of the commitment of the biggest container ship-owners is confirmed by table 2 in which it is demonstrated that amongst the 17 biggest.
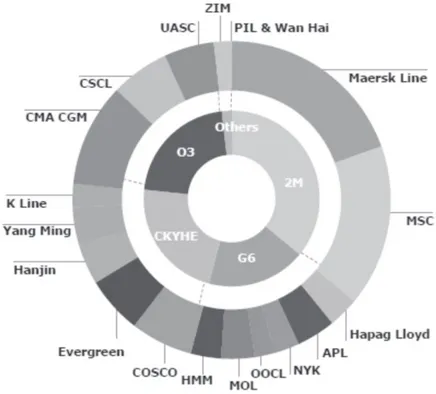
(24) 24. Ernest Czermański. ship-owners only one of them − Hamburg Süd − is not a member of an alliance, other than its close cooperation with Hapag-Lloyd. It is currently considering joining the O3 alliance10. The degree of concentration of the particular market segments of worldwide container shipping is clearly shown by analyzing three major worldwide relations: Far East – Europe, Far East – North and South America up to their West Coast (the so called transpacific relation) and the Europe – North and South America up to their East Coast the (so called transatlantic relation). Those three relations are shown separately below, where the shipping capacity of every single ship-owner operating on specific relations, measured in TEU, has been calculated and their participation on partial markets shown in pie charts. The first relation, as shown in fig. 7 is, by just a small fraction (approximately 2%), serviced by just two ship-owners out of the 4 main previously mentioned alliances, in which case we may call it an oligopoly. This is most certainly the result of its importance as the most crucial relation on a global scale, acting, as it does, as a determinant of world trends, servicing the biggest vessels and generating the largest flow of containers. There is relative stabilization between the alliances within that relation and a lack of clear dominance of one of them (2 m has a slight advantage but not more than 1/3 of the market).. figure 7. Owners structure of the Far East – Europe container shipping relation Source: A. Woolich, Shipping lines, shippers, ports – the alliances debate, presentation for the “Intermodal Europe 2016” conference, Hamburg.. 10. Drewery Shipping Consultancy, www.joc.com (4.05.2015)..
(25) Container shipping development for world trade. 25. figure 8. Owners structure of the Transpacific container shipping relation Source: A. Woolich, Shipping lines, shippers, ports – the alliances debate, presentation for the “Intermodal Europe 2016” conference, Hamburg 2015.. Looking at the two remaining relations, the first one has the lowest participation of ship-owners from outside alliances, therefore, it is dominated by few service providers. In the transpacific relation there are four ship-owners from outside alliances, and their participation in the total tonnage capacity is over 6%. Even amongst the alliances, there is a lack of a clear leader, and the market appears to be split. Finally, the last transatlantic relation, is based on approximately 9% on the five ship-owners from outside of the global alliances. It is, however, in the competition between the two alliances, where the biggest one, 2M, which includes almost 50% of shipping abilities, is strongly challenged by the G6 alliance. The remaining two alliances are fulfilling a similar role as outsiders, as previously mentioned. The benefits that result from the cocenttration of container shipping are so evident and valuable that they represent a constant temptation for ship-owners for further integration beyond divisions. On occasion, when such integration is a threat to entire countries, it becomes the target of administrative proceedings which can result in ship-owners being refused registry (and therefore permission to enter the market) with big alliances. Other than participating container alliances, ship-owners compete with each other mostly in price (both in spot transactions, and long-term contracts), but also in: sales techniques, customer relations, as well as providing support during transport services, intermodal handling of given containers, and other services offered during the transport process (e.g. LCL/FCL assembling, storage, packing),.
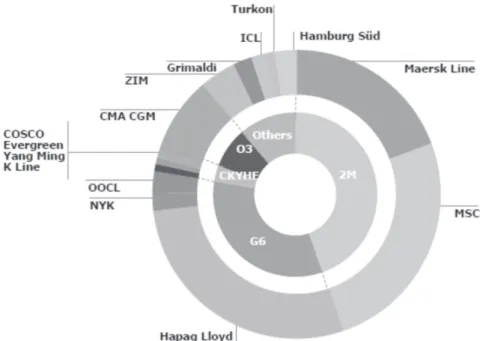
(26) 26. Ernest Czermański. figure 9. Owners structure of the Transatlantic container shipping relation Source: A. Woolich, Shipping lines, shippers, ports – the alliances debate, presentation for the “Intermodal Europe 2016” conference, Hamburg 2015.. but also in the size and the network connections structure, especially in the complementary context of feeder services. However within the alliance, based on the negotiated share in service, shipowners compete only in passage frequency and the capacity of their own fleets. Membership of alliances gives ship-owners many benefits, primarily: – improved tonnage usage, including ability to involve the biggest vessels, with better usage of shipping abilities; – lower fuel costs measured per slot or container; – improved capabilities in handling empty containers in the range of their wider usage; – lower CO2 emissions by optimizing the lines network and eliminating unprofitable sections/routes. Container alliances also provide significant benefits for customers: – higher vessel call frequency, which means more loading opportunities for the client; – mhigher number of direct port – port connections; – higher number of total calls; – lower requirements in transshipment in transit; – improved service capabilities; – more flexible routes. In consequence, demand can be met with higher quality offers, this does not, however, necessarily mean better prices, because the main aim of alliances are to maximize profits..
(27) Container shipping development for world trade. 27. The last factor that should be mentioned in this analysis is the brand new completed restructuring of the Panama Channel. Until this event it constituted a bottleneck in the Asia – American East Coast relation due to the limited passage capacity for vessels up to 6000 TEU (the main factor inhibiting the possibility of crossing this route was its size restrictions: width up to 32,31 m, length of up to 294,23 m and draught up of up to 12,04 m). In its new state the canal will allow for the passage of the new „Panamax” size vessels which will be of approximately 12 600−13 000 TEU, as well as vessels which are 366,0 m long, 29,0 m wide and 15,02 m deep. During the last few years container shipping has almost entirely switched to vessels bigger than 6000 TEU, hence, the current shape of shipping lines has been determined by the limited capacity of the Panama Canal. The planned investment could, therefore, significantly change the future shape of ocean services within the Asia-America relation.. Summary and an attempted look into the future The occurrences and processes mentioned in this monograph clearly show that recent years have brought significant changes to container shipping, as well as establishing new conditions for the functioning of container lines, whilst simultaneously setting the new boundaries, within which shipping will continue to expand in the near future. Taking all factors into consideration newly functioning conditions will include: – a small increase in the worldwide container freight volume, at an 4−6% interval per year; – on a regional scale, few but strong pro-growth impulses (the economic opening of Iran, ‚return’ of import to Algeria, Egypt, Tunisia and Morocco, and also the strong and over average economic development of countries in the Baltic Sea Region); – low prices of crude oil and fuels which are likely to remain at the current level for the next two years; – new navigation opportunities − New Panama Canal, allowing geographical change in some routes on the Asia-North America East Coast relation; – further integration of ship-owners – both in alliance, and in merge/fusion forms; – few opportunities to absorb those existing services and lines that are going out of business by the bigger ship-owners; – further pressure on budget cuts inside ship-owner businesses; – further pressure on lowering freight rates and severe difficulties in implementing justified rate increases, accompanied by an increase in the flexibility of ship-owners in response to such pressure; – substantial variability of freight rates in the short term;.
(28) 28. Ernest Czermański. – order fulfillment on the new, much bigger vessels, while currently operated vessels remain in service, however lacking the potential effectiveness which could be associated with new vessels; – the Cascade Effect in container ship class – the so called cascade appearance of much bigger types of containership with low service costs in Chinese shipyards; – the transfer of average sized vessels (4000−9000 TEU) from ocean routes to short sea shipping and feeder type routes or the increasing problem of inactivity among smaller and older, yet still functional, vessels; – increasingly difficult choices of arrival port, due to the technical limitation of port entrances, as well as terminal services handling delivered and received containers; – prolonged ocean lines and rerouting of the feeder services; – further pressure on shipping to reduce the negative impact on the environment (the soon to be enforced Tier II – emission limits NOx and the verification of Tier III for newly built vessels; most likely new SECA zones after 2018 on the Mediterranean Sea, around Mexico, Japan, Norway – emission limits SOx).. references 1. Branch A., Element of Shipping, Routledge Publishing, London 2007 2. Challenge to the Industry. Securing Skilled Crews in Today’s Marketplace, Deloitt’s Shipping & Ports Group Report, London 2011 3. David M., Gollasch S., Hewitt C., Global Maritime Transport and Ballast Water Management, Springer Netherlands, Dordrecht 2015 4. Fossey F., Outlook & market trends – the European perspective, lecture on the international conference “Intermodal Europe”, Hamburg 2015 5. Kujawa J., Koncentracja kapitałowa i operacyjna w żegludze kontenerowej, “Współczesna Gospodarka” 2016, no. 4 6. Laursen W., MOL orders world’s biggest container ship, “The Maritime Executive”, March 2015, http://www.maritime-executive.com/article/ 7. Port Investment and Container Shipping Markets, OECD Publishing, Paris 2015 8. Sulphur content in ships bunker fuel in 2015. A study on the impacts of the new IMO regulations on transportation costs, Report of the Transport and Communication Ministry of Finland, Helsinki 2009 9. Sulphur Regulation – technology solutions and economic consequences for the Baltic Sea Region shipping market, ed. E. Czermański, Instytut Transportu i Handlu Morskiego, Sopot 2014 10. Rubens S., Key trends in the container shipping industry, lecture during the international conference “Intermodal Europe”, Hamburg 2015 11. Woolich A., Shipping lines, shippers, ports – the alliances debate, presentation for the “Intermodal Europe 2016”, Hamburg 2015 12. www.joc.com.
(29) Container shipping development for world trade. 29. roZWÓJ ŻeGluGi konteneroWeJ W oBSŁuDZe HanDlu miĘDZYnaroDoWeGo. StreSZcZenie Niniejsza analiza powstała na bazie dostępnych danych charakteryzujących światową żeglugę kontenerową oraz rynków zależnych, w tym przede wszystkim paliw morskich. Celem artykułu jest wskazanie mikroekonomicznych oraz makroekonomicznych warunków funkcjonowania żeglugi kontenerowej w gospodarce globalnej w obszarach kosztowym oraz przychodowym. Na tej podstawie wyciągnięto wnioski, które sprowadzają się do podstawowego stwierdzenia, że żegluga kontenerowa ma realne przesłanki dalszego rozwoju, a jej wymiar globalny sprawia, iż staje się ona coraz bardziej skoncentrowana kapitałowo i organizacyjnie. Wskazano tu również czynniki, które ten rozwój będą utrudniać lub spowalniać..
(30) robert marek. roLa port community system W portacH morSkicH. StreSZcZenie. Artykuł poświęcony jest istocie port community system i jego rozwojowi w portach morskich zlokalizowanych w krajach wysoko rozwiniętych. Szczegółowo omówiono definicje port community system w celu wskazania cech odróżniających ten system od innych platform elektronicznej wymiany danych1. Przedstawiono również systemy typu port community funkcjonujące w wybranych portach morskich. Opisano korzyści i koszty, jakie mogą pojawić się w okresie wdrażania i utrzymania systemu informacyjnego.. Wstęp Obecnie współczesne porty morskie, obok tradycyjnych funkcji, pełnią również funkcję centrum logistyczno-dystrybucyjnego i zajmują się nie tylko koordynacją działań uczestników łańcuchów transportowych, lecz także łańcuchów logistycznych. W przeszłości rozwój portu morskiego i podmiotów z nim współpracujących determinowany był głównie rozwojem infrastruktury technicznej (w tym infrastruktury portowej) i poziomem jakości świadczonych usług portowych. Jednak pod koniec XX w. szczególnego znaczenia zaczął nabierać rozwój infrastruktury informacyjnej, która prawidłowo wykorzystana stała się warunkiem 1. „W informatyce przez dane rozumie się informacje przedstawione w sposób dogodny do przechowywania, przesyłania lub przetwarzania. Informacje te przedstawione są w sformalizowanej postaci liter, cyfr oraz znaków specjalnych możliwych do przekazywania przekształcanych w komupterach”. J. Penc, Leksykon biznesu, Agencja Wydawnicza Placet, Warszawa 1997, s. 72. W niniejszym artykule pojęcia danych i informacji będą stosowane zamiennie..
(31) Rola port community system w portach morskich. 31. determinującym szybką i efektywną wymianę towarową2. Infrastruktura informacyjna w obszarze obrotu portowo-morskiego przesunęła swój punkt ciężkości od infrastruktury informacyjnej, przypisanej do konkretnego podmiotu, do infrastruktury informacyjnej, łączącej swoim zasięgiem i zakresem całą społeczność podmiotów uczestniczących w obrocie portowo-morskim, a nawet szerzej − w łańcuchu logistycznym, przyjmując postać port community system (PCS). Port community system w Europie ma długą tradycję. Pierwsze tego typu systemy były tworzone w Niemczech, we Francji i w Wielkiej Brytanii (tam zaczęły działać pod koniec lat 70. i na początku lat 80. ubiegłego wieku)3. Takie zaś kraje, jak Hiszpania i Turcja rozpoczęły tworzenie port community system na początku XXI w. Kluczowymi czynnikami utworzenia PCS była zarówno potrzeba znormalizowania platformy komunikacyjnej umożliwiającej usprawnienie przepływu ładunków pod względem punktualności, niezawodności i kosztów, jak i konieczność poprawienia pozycji konkurencyjnej portów morskich. Porty morskie oraz zespoły portów morskich, które wdrożyły PCS, zwiększyły swoje obroty (o co najmniej 15%4), a jednocześnie obniżyły koszty swojego funkcjonowania na rynku transportowym oraz skróciły czas obsługi ładunków. Szczególne znaczenie w funkcjonowaniu port community system ma integracja wszystkich uczestników obrotu portowo-morskiego za pomocą systemu informatycznego opartego na technologii komputerowej, rozwiązującego problemy przepływu ładunków, informacji oraz środków pieniężnych. Port community system składa się z kilku systemów informatycznych. Jednocześnie oparty jest na współpracy między systemami informatycznymi, w ramach współpracujących ze sobą podmiotów, bez względu na to, czy są one częścią składową systemu jednego przedsiębiorstwa, czy grupy przedsiębiorstw, np. morskich terminali kontenerowych. Wzajemna współpraca interesariuszy obrotu portowo-morskiego w ramach port community system polega na wymianie danych.. 1. pojęcie port community system Znaczenie port community system dla rozwoju portów morskich oraz całej społeczności zajmującej się obrotem portowo-morskim zostało dostrzeżone przez Parlament Europejski i Radę Unii Europejskiej. W rezultacie obie instytucje 20 października 2010 r. wydały dyrektywę w sprawie formalności sprawozdawczych dla statków wchodzących do lub wychodzących z portów państw członkowskich (uchylając dyrektywę 2002/6/WE5). Zgodnie z tą dyrektywą kraje członkowskie EU są zobligowane do wprowadzenia port community system. Jest to rodzaj e-platformy pozwalającej na szybszy obieg dokumentów drogą 2. S. Abt, H. Woźniak, Podstawy logistyki, Wydawnictwo Uniwersytetu Gdańskiego, Gdańsk 1993, s. 67. EPCSA, www.epcsa.eu (6.02.2016). 4 Tamże. 5 http://isap.sejm.gov.pl/RelatedServlet;jsessionid=44C3EA535256E36030395DC7CABD4893?id=W DU20112281368&type=15&isNew=true (10.03.2016). 3.
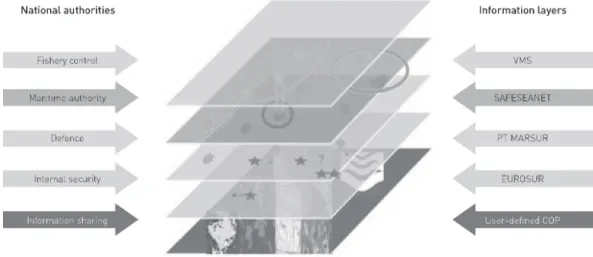
(32) 32. Robert Marek. rysunek 1. Porty morskie posiadające port community system w 2016 r. Źródło: EPCSA, www.epcsa.eu (6.02.2016).. elektroniczną. Wytyczne dyrektywy UE 2010/65/UE6 powstały w oparciu o Konwencję o ułatwieniu międzynarodowego obrotu morskiego przyjętą przez IMO w 1965 r. Port community system działa na podstawie wytycznych Komisji Unii Europejskiej usiłującej stworzyć jednolity rynek cyfrowy7 we wszystkich krajach członkowskich. Interesariuszami port community system są wszystkie podmioty bezpośrednio i pośrednio uczestniczące w obrocie portowo-morskim. W wyniku realizacji wymienionej dyrektywy oraz potrzeby posiadania danych w czasie rzeczywistym wiele portów na świece stworzyło i wdrożyło sektorową platformę elektronicznej wymiany danych (rysunek 1). J. Rodon i J. Ramis-Pujol8 określają port community system jako elektroniczną platformę, która łączy wiele systemów informacyjnych, użytkowanych przez liczne organizacje, które tworzą społeczność portu morskiego. PORTEL9 zaś definiuje PCS jako platformę współpracy, która ułatwia elektroniczną wymianę informacji dotyczących handlu i spraw administracyjnych, tworząc relację B2B w otoczeniu portu. European Port Community Systems Association (EPCSA)10 uszcze6. Tamże. Według europa.eu ujednolicony rynek cyfrowy może wygenerować w gospodarce unijnej wszystkich krajów członkowskich ok. 450 mld euro rocznie, jednocześnie przyczyniając się do powstania tysięcy miejsc pracy; http://europa.eu/european-union/index_pl (6.02.2016). 8 J. Rodon, J. Ramis-Pujol, Exploring the Intricacies of Integrating with a Port Community System, Proceedings of the 19th Bled eConference “eValues”, Bled 2006. 9 PORTEL, Inventory of Port Single Windows and Port Community Systems, „Sustainable Knowledge Platform for the European Maritime and Logistics Industry”. http://www.eskema.eu/DownloadFile.aspx?table Name=tblSubjectArticles&field=PDF%20F ilename&idField=subjectArticleID&id=231 (25.02.2016). 10 EPCSA, www.epcsa.eu (20.04.2016). 7.
(33) Rola port community system w portach morskich. 33. góławia tę definicję, określając port community system jako neutralną i otwartą platformę umożliwiającą inteligentną i bezpieczną wymianę informacji pomiędzy publicznymi i prywatnymi interesariuszami w celu podniesienia efektywności i umocnienia pozycji konkurencyjnej portów morskich i lotniczych11. Należy zwrócić uwagę, że definicja port community system kładzie szczególny nacisk na takie kluczowe elementy sytemu, jak: otwartość, neutralność, bezpieczeństwo oraz inteligencja. Przez otwartość systemu12 można rozumieć, że każdy interesariusz obrotu portowo-morskiego może do niego przystąpić po uiszczeniu opłaty eksploatacyjnej, związanej z utrzymaniem platformy elektronicznej. Neutralność systemu oznacza, że podmiot odpowiedzialny za jego utrzymanie nie może być zaangażowany w działalność związaną z obrotem portowo-morskim, a jednocześnie gwarantujący, że dane nie zostaną przekazane niepowołanym osobom. W przypadku, gdy port community system administrowany byłby przez podmiot biorący bezpośredni udział w działalności obrotu portowo-morskiego, to zaistniałaby asymetria informacji, w której wyniku operator systemu miałby przewagę nad swoimi konkurentami. Administratorem tego systemu nie może być więc żaden morski terminal kontenerowy i jest to zasadniczy warunek przystąpienia konkurencyjnych terminali do tego systemu. Bezpieczeństwo systemu oznacza zagwarantowanie poufności danych, w taki sposób, aby nie przedostały się one do niepowołanych osób. Inteligencja systemu oparta jest na automatyzacji procesów przetwarzania danych. W prezentowanej definicji nie pojawia się pojęcie niezawodności systemu, a jest to bardzo istotny warunek jego funkcjonowania. Niezawodność systemu powinna być zagwarantowana przez jego operatora, gdyż port community system musi funkcjonować przez 24 godziny na dobę przez cały rok. Każda awaria systemu musi zostać usunięta w bardzo krótkim czasie, ponieważ ogranicza możliwość realizacji operacji biznesowych przez wszystkich uczestników obrotu portowo-morskiego, a tym samym może przyczynić się do generowania wysokich strat. 11. Port community systems zostały wdrożone w sektorze transportu lotniczego. Główne porty lotnicze funkcjonujące na świecie mają airport community systems, aczkolwiek można się spotkać z inną nazwą takich systemów, tj. cargo community system – CCS. Systemy te umożliwiają wymianę informacji między klientami, służbą celną i innymi agendami władz państwowych uczestniczącymi w transporcie lotniczym. Rozwój platform współpracy w społeczności lotniczej został ułatwiony przez już wdrożone standardy komunikacji znane jako UNECE. Większość airport community systems ma swoje wewnętrzne standardy, ale komunikują się z innymi systemami oraz społecznościami handlowymi wykorzystującymi międzynarodowe standardy transportu lotniczego, w szczególności standardy przyjęte przez IATA dla EDI i dla XML. Typowe usługi oferowane przez airport community systems są praktycznie takie same jak usługi oferowane przez port community system. Również korzyści osiągane przez interesariuszy obu systemów informacyjnych są podobne. Jedyna różnica pomiędzy tymi systemami polega na tym, że w airport community systems są uszczegółowione standardy komunikacyjne przez IATA dla poszczególnych grup przewoźników lotniczych. W transporcie morskim interesariusze stworzyli własne platformy wymiany informacji, przyjmując własne standardy bezpieczeństwa oraz programy operacyjne, co powoduje trudności dotyczące wdrożenia jednolitego systemu informacyjnego oraz podnosi koszty ich integracji. 12 W Niemczech każdy podmiot uczestniczący w obrocie portowo-morskim musi przystąpić do port community system..
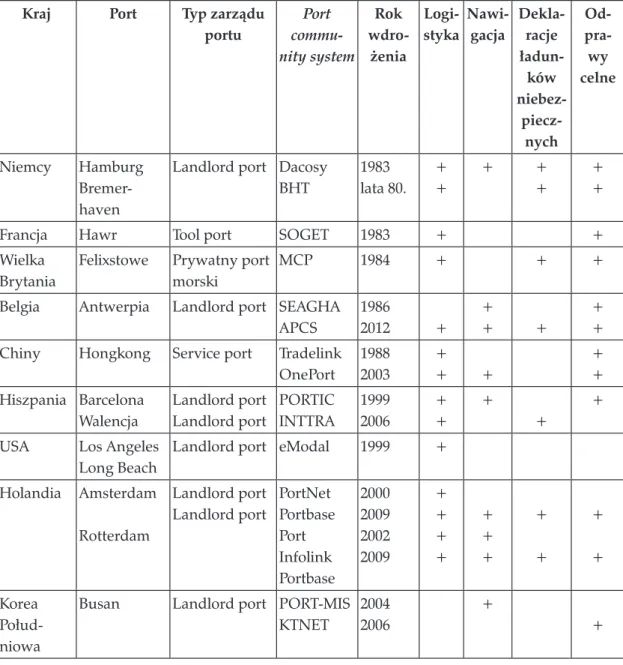
(34) 34. Robert Marek. W wielu portach na świecie powstały różne rozwiązania PCS. Przykładowo, F.J. Srour, M. van Oosterhout, P. van Baalen i R. Zuidwijk opracowali kategoryzację typowej architektury PCS13. Przeprowadzone przez nich badania koncentrują się w szczególności na treści otoczenia i działaniach, które doprowadziły do rozwoju port community system w dziesięciu przebadanych portach morskich. Badania przeprowadzone przez J. Rodona i J. Remis-Pujola14 na temat systemu komunikacji wdrożonego w portach morskich Hiszpanii wskazują zaś na konieczność zintegrowania różnych systemów informacyjnych w jedną centralną platformę komunikacyjną. Natomiast F. Córdova i C. Durán15 dokonali analizy rozwiązań port community system oraz rozwinęli zestaw wskaźników, które umożliwiają rozwój zarządzania wiedzą w głównych podmiotach uczestniczących w tej elektronicznej platformie. GIL16 w wynikach przeprowadzonych badań wskazał różne charakterystyki badanych platform PCS. Ponadto zwrócił uwagę na to, że naturalnymi inicjatorami tworzenia port community system są zarządy portów morskich.. 2. Zakres usług świadczonych przez port community system Zakres usług świadczonych przez port community system jest zróżnicowany i dostosowany do potrzeb informacyjnych społeczności uczestniczącej w obrocie portowo-morskim. Jednocześnie system ten ulega ciągłym przeobrażeniom, gdyż coraz więcej uczestników tej elektronicznej platformy widzi bezpośrednie korzyści, jakie mogą osiągnąć w wyniku szybkiego dostępu do danych. Zakres świadczonych usług w ramach port community system zostanie przedstawiony na przykładzie rozwiązań zastosowanych w portach w: Hamburgu (Niemcy), Busan (Korea Południowa), Hongkongu (Chiny) oraz Rotterdamie (Holandia). Port Hamburg ma system komunikacji (Dakosy) łączący operacje portowe z operacjami realizowanymi przez przedsiębiorstwa logistyczne, funkcjonujące w obrębie portu morskiego. Ten system komunikacji został utworzony w 1982 r. i łączy systemy EDI i transportu za pomocą International Federation of Port Cargo Distribution17. Obecnie Dakosy ma charakter single window18 portu w Hamburgu, 13. F.J. Srour, M. van Oosterhout, P. van Baalen, R. Zuidwijk, Port Community System Implementation: Lessons Learned from International Scan, „Transportation Research Board”, 87th Annual Meeting, Washington 2008. 14 J. Rodon, J. Ramis-Pujol, Exploring the Intricacies..., s. 12. 15 F. Córdova, C. Durán, A Business Model Design for the Strategic and Operational Knowledge Management of a Port Community, „Annals of Data Science” 2014, no. 1, s. 191−208. 16 European Port Community Systems Association, How to develop a port community system, http:// www.epcsa.eu/armoury/resources/epcsahow-to-develop-a-pcs-december-2011.pdf (17.02.2016). 17 K. Forward, Recent Developments in Port Information Technology, Digital Ship Ltd., London 2003. 18 Single window jest rozwiązaniem systemowym, umożliwiającym przekazanie za pomocą jednego dokumentu elektronicznego wszystkich informacji wymaganych przez wszystkie służby kontrolne danego państwa. W Polsce single window jest wykorzystywane w obrocie ładunkami skonteneryzowanymi. Jednocześnie w ramach single window wszystkie podmioty uczestniczące w obrocie kontenera-.
Obraz
+7

Outline
pojęcie port community system
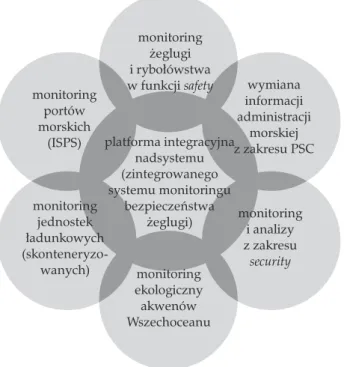
Główne funkcjonalności modelu zintegrowanego systemu monitoringu bezpieczeństwa transportu morskiego
kierunki rozwoju współczesnych łańcuchów dostaw
rola nowoczesnych powierzchni magazynowych w polsce w realizacji operacji łańcuchów dostaw
pomorskie centrum logistyczne w Gdańsku
centrum logistyczne w Gliwicach
Działania na rzecz rozwoju sektora offshore na pomorzu
Działalność aktywizująca przedsiębiorczość
obraz przedsiębiorczości w badaniach
koszty bezrobocia młodych
Powiązane dokumenty
Głową państwa jest Prezydent wybierany na kadencję 5-letnią przez Riigikogu lub kolegium wyborców, składające się z członków Riigikogu oraz przedstawicieli rad
Ale chyba warto ją wykonać i powalczyć o takie stopnie na świadectwie, które wywołają u Was
Przedstawiono genezê i podzia³ opcji rzeczowych oraz warunki ich stosowania w porównaniu do tradycyjnych dyskontowych metod oceny projektów.. Omówiono genezê i para-
czy podejmie czy nie. Jak podejmie to będzie prosić o dokumenty. Gdy wszystko będzie dostarczone to wtedy nasza sprawa musi być rozstrzygnięta w ciągu miesiąca od tego
Decyzja o wyborze odpo- wiedniego sprzętu powinna być podjęta na podstawie prze- prowadzonej przez pracodawcę oceny ryzyka (na stanowisku pracy) zawodowego zranienia ostrym
- przyjęcie sieci T90 o rozmiarze oczka 40 mm w celu zmniejszenia połowów małych rozmiarów morszczuka i barweny. Ponadto kontynuowane będą dalsze wysiłki naukowe w celu
W miejscu wyznaczonym do przeprowadzenia przetargu w trakcie prowadzenia przetargu oprócz członków komisji przetargowej mogą przebywać uczestnicy przetargu (pełnomocnicy),
Wyrażam zgodę na przetwarzanie przez organizatorów Konkursu danych osobowych mojego dziecka w celach wynikających z organizacji Konkursu zgodnie z Rozporządzeniem
